Chapter 5 Comparison–barchart, boxplots, synaplots
Comparison as assessing overlapping distributions
5.1 Graph considerations for communication: aggregation, abstraction, complexity
5.1.1 Simple bar chart
library(tidyverse)
library(ggforce)
library(ggthemes)
library(ggstance)

mtcars.df = mtcars
mtcars.df = mtcars.df %>% mutate(cyl = as.factor(cyl))

s.mtcars.df = mtcars.df %>% group_by(cyl) %>% summarise(m.hp = mean(hp), se.hp= sd(hp)/n()^.5)


ggplot(data = s.mtcars.df, aes(x = cyl, y = m.hp)) +
  geom_bar(stat="identity")
ggplot(data = s.mtcars.df, aes(x = cyl, y = m.hp)) +
  geom_col()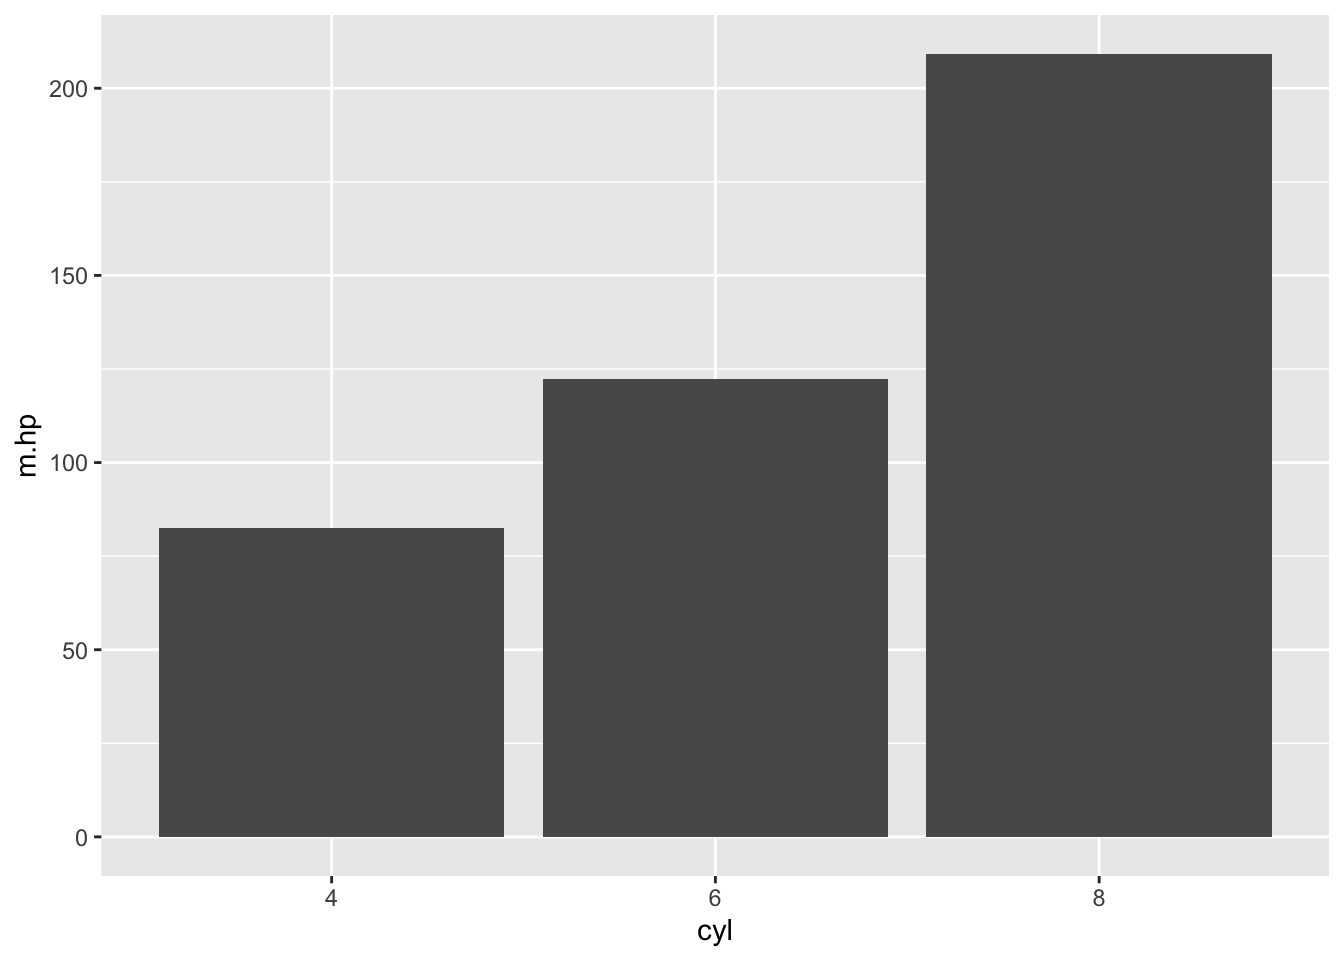
## Change order of bars
cyl.order <- c("8", "6", "4")
ggplot(data = s.mtcars.df, aes(x = cyl, y = m.hp)) +
  geom_col() +
  scale_x_discrete(limits = cyl.order)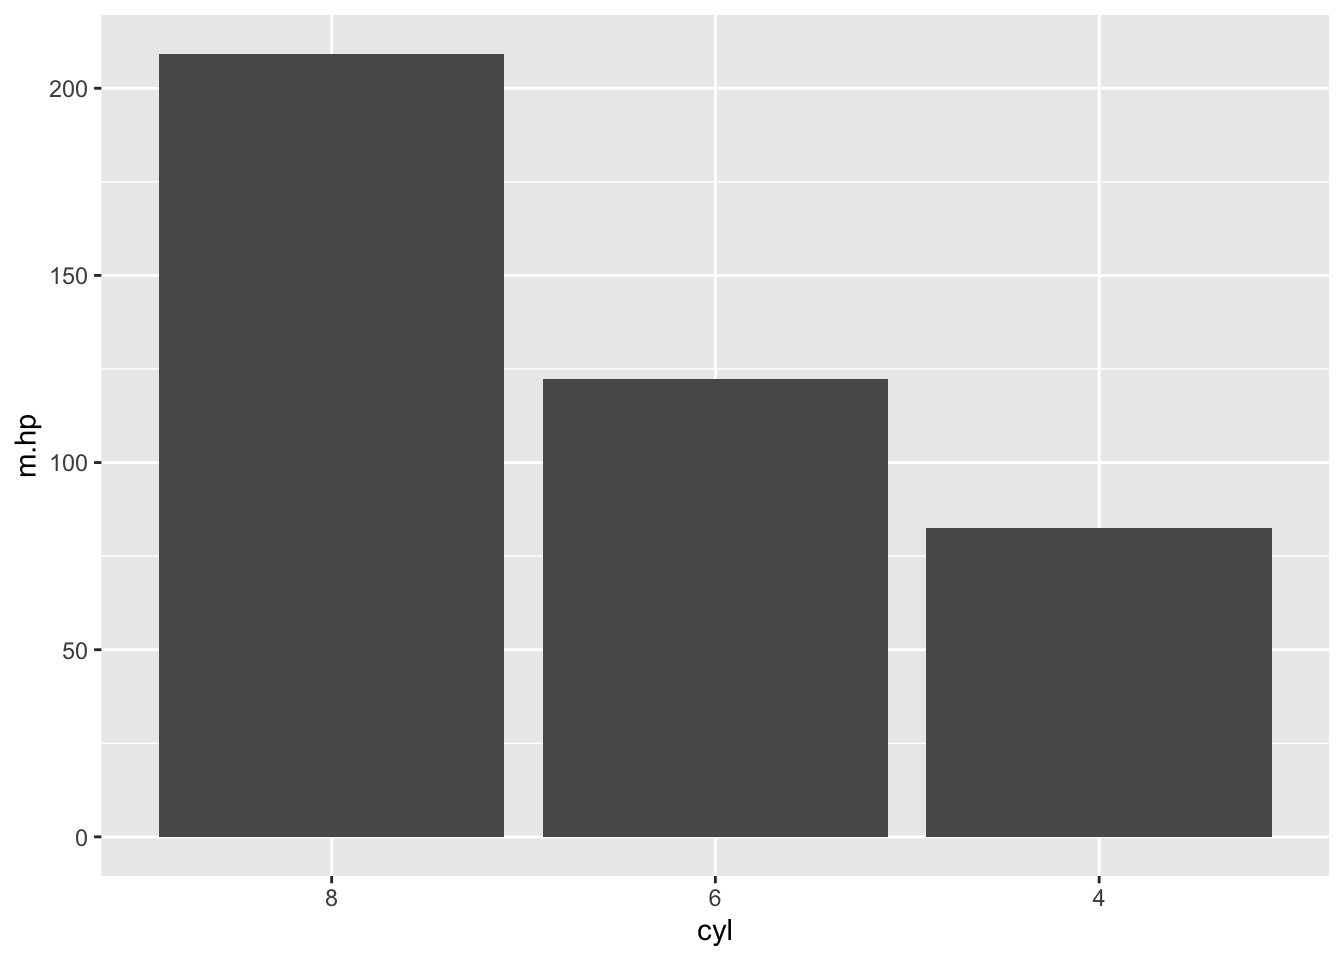
5.1.2 Bar chart with error bars
ggplot(data = s.mtcars.df, aes(x = cyl, y = m.hp)) +
  geom_bar(stat="identity")+
  geom_linerange(aes(ymin=m.hp-2*se.hp, ymax=m.hp+2*se.hp))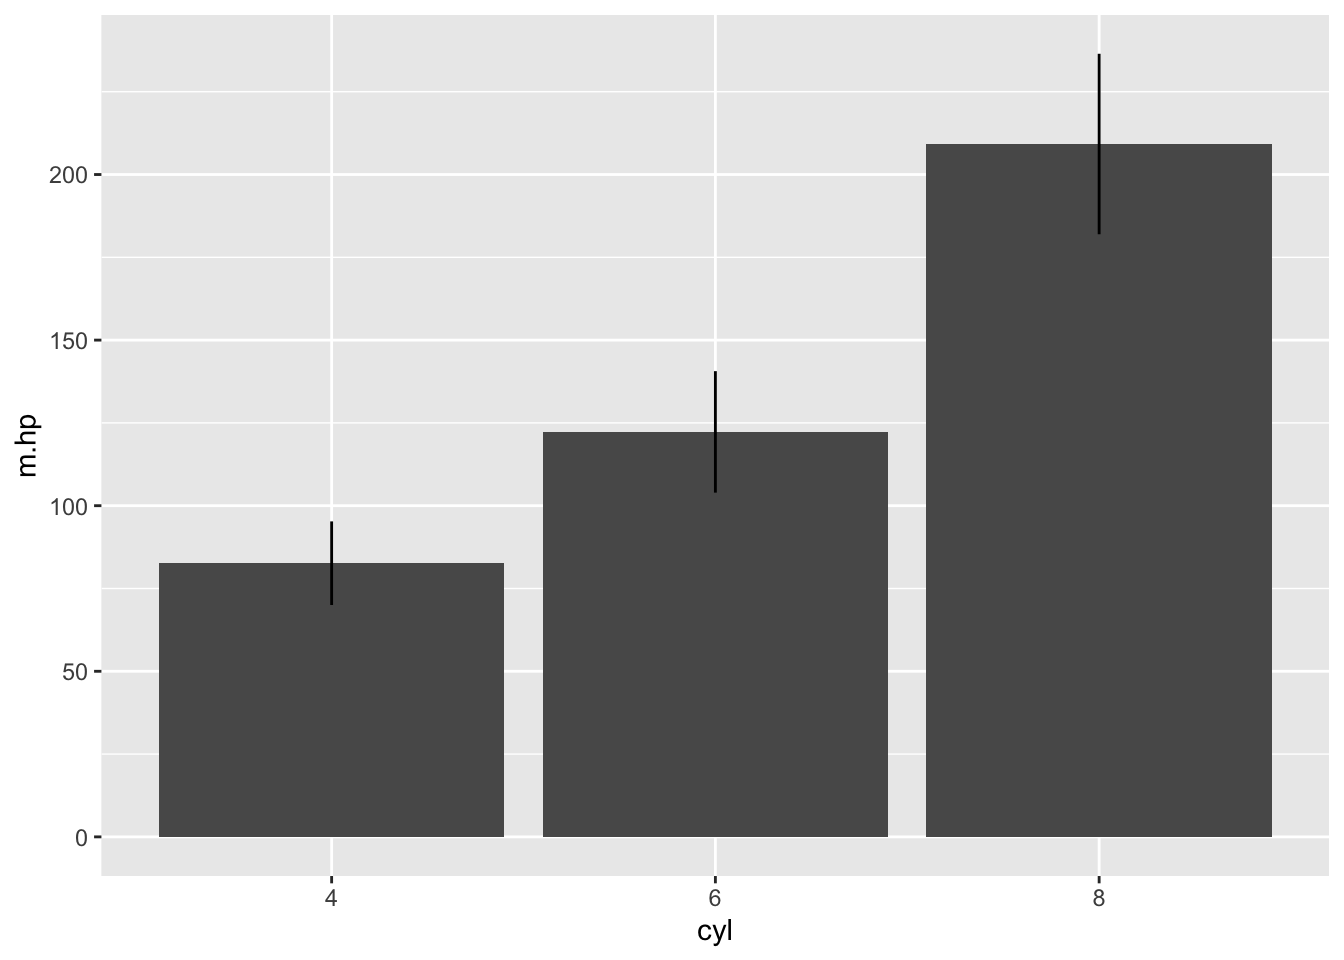
ggplot(data = s.mtcars.df, aes(x = cyl, y = m.hp)) +
  geom_bar(stat="identity")+
  geom_linerange(aes(ymin=m.hp-2*se.hp, ymax=m.hp+2*se.hp))+
  geom_point(data = mtcars.df, aes(cyl, hp), position = position_jitter(width = .2, height = 0))
5.1.3 dotplot and offset range plot
## Set seed and create data
set.seed(999)
df = data_frame(A = runif(12,1,17), B = runif(12, 2, 8))


l.df = gather(df, condition, value)
l.df$condition = as.factor(l.df$condition)
m.l.df = l.df %>% group_by(condition) %>% summarise(m.value = mean(value, na.rm=TRUE),
      n= sum(!is.na(value)), sd=sd(value, na.rm=TRUE), sde=sd(value, na.rm=TRUE)/n^.5,
       ci= 2*sde)
m.l.df$n.condition = as.numeric(m.l.df$condition)-.05


## Plot with offset for mean and error bar
ggplot()+
  geom_dotplot(data = filter(l.df, condition=="A"|condition=="B"),
               aes(condition, value), binaxis = "y", stackdir = "up")+
  geom_linerange(data = filter(m.l.df, condition=="A"|condition=="B"),
                 aes(n.condition, ymin=m.value-ci, ymax=m.value+ci), color="grey50") +
  geom_point(data = filter(m.l.df, condition=="A"|condition=="B"),
             aes(n.condition, y= m.value), shape = 21, size = 4, fill="grey", alpha=.7) +
  labs(x="", y="") +
  ylim(2, 15)
## `stat_bindot()` using `bins = 30`. Pick better value with `binwidth`.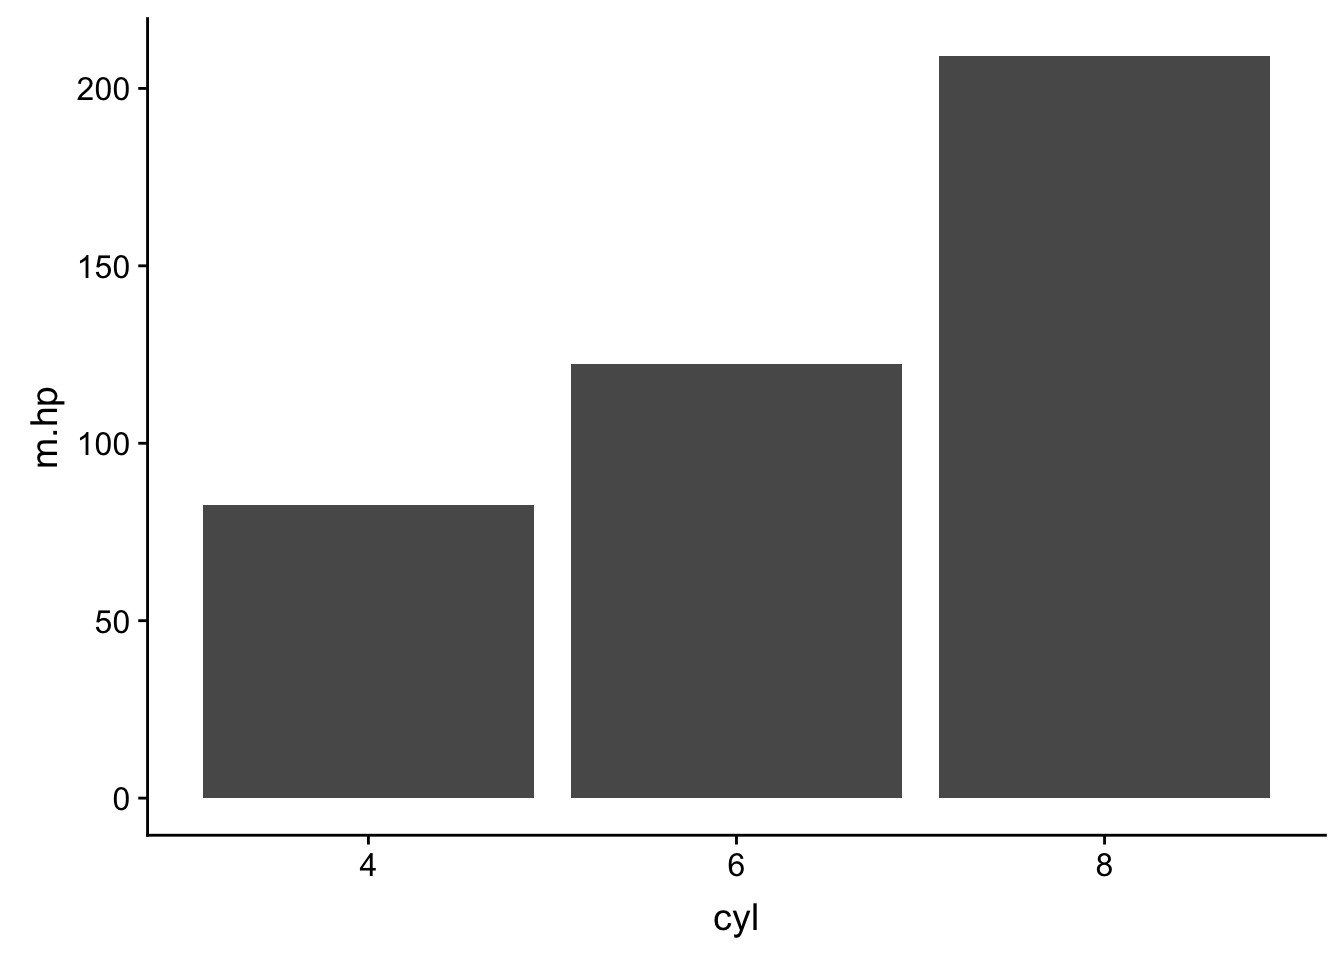
5.1.4 Statistical significance in context
ggplot(data = mtcars.df, aes(x = as.factor(cyl), y = hp)) +
  geom_boxplot(colour = "darkgrey") +
  geom_point(stat="summary", fun.y = "mean", size = 6, shape = 1) +
  geom_pointrange(stat="summary", fun.data = "mean_cl_boot") +
  geom_dotplot(binaxis = "y", stackdir = "center", binwidth = 1,
               dotsize = 6,alpha = .3, color = "black", fill = "red") +
geom_hline(aes(yintercept = mean(hp)), size = 1.2) 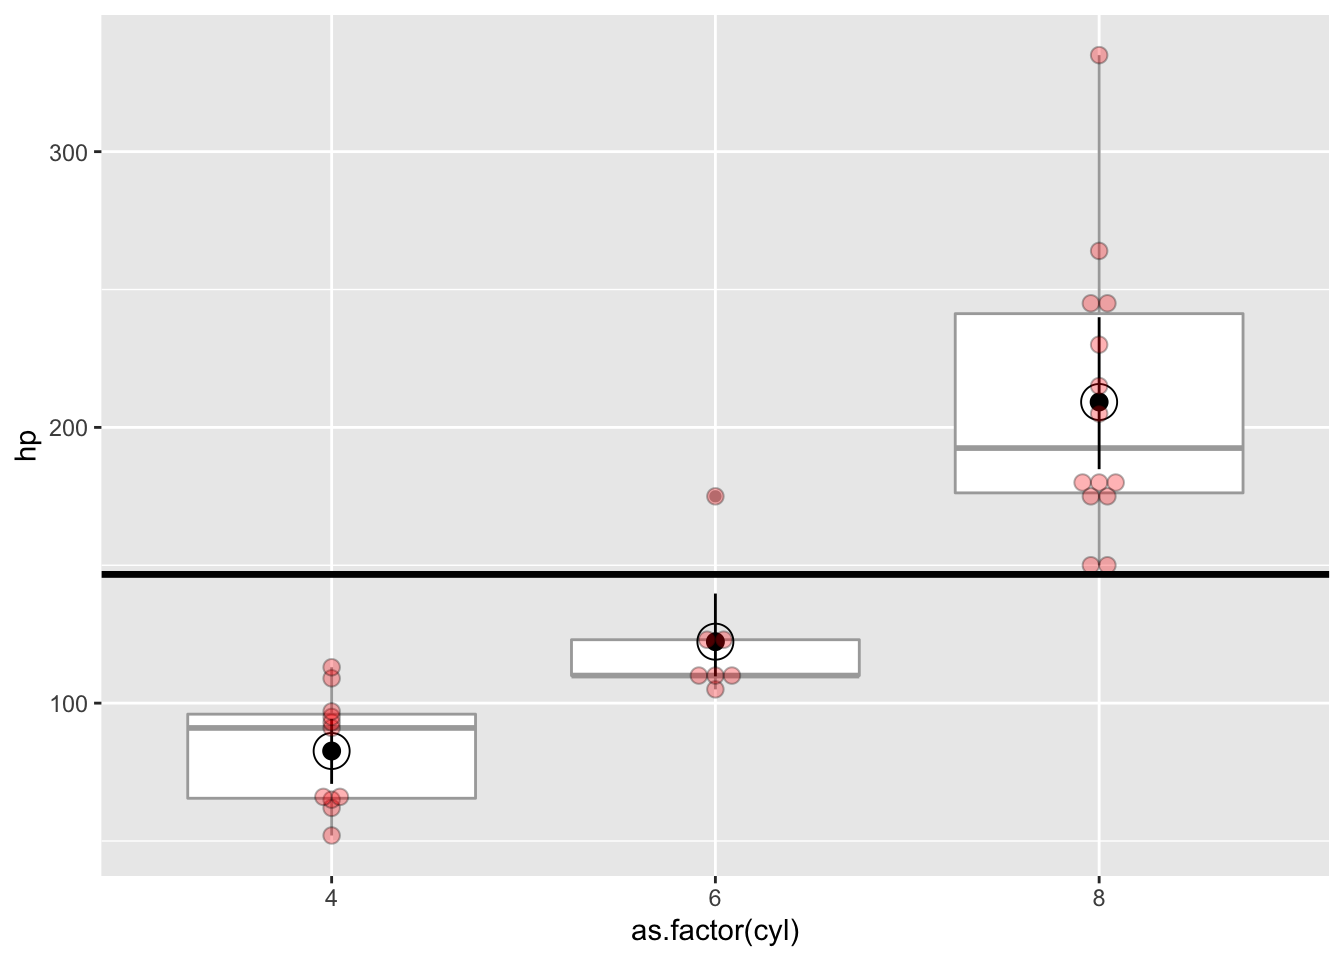
5.2 Comparing distributions, box, violyn, and sina plot
library(tidyr)

ggplot(data = s.mtcars.df, aes(x = cyl, y = m.hp)) +
  geom_col()+
  geom_linerange(aes(ymin=m.hp-2*se.hp, ymax=m.hp+2*se.hp))
ggplot(data = s.mtcars.df, aes(x = cyl, y = m.hp)) +
  geom_col()+
  geom_linerange(aes(ymin=m.hp-2*se.hp, ymax=m.hp+2*se.hp))+
  geom_point(data = mtcars.df, aes(cyl, hp), position = position_jitter(width = .2, height = 0))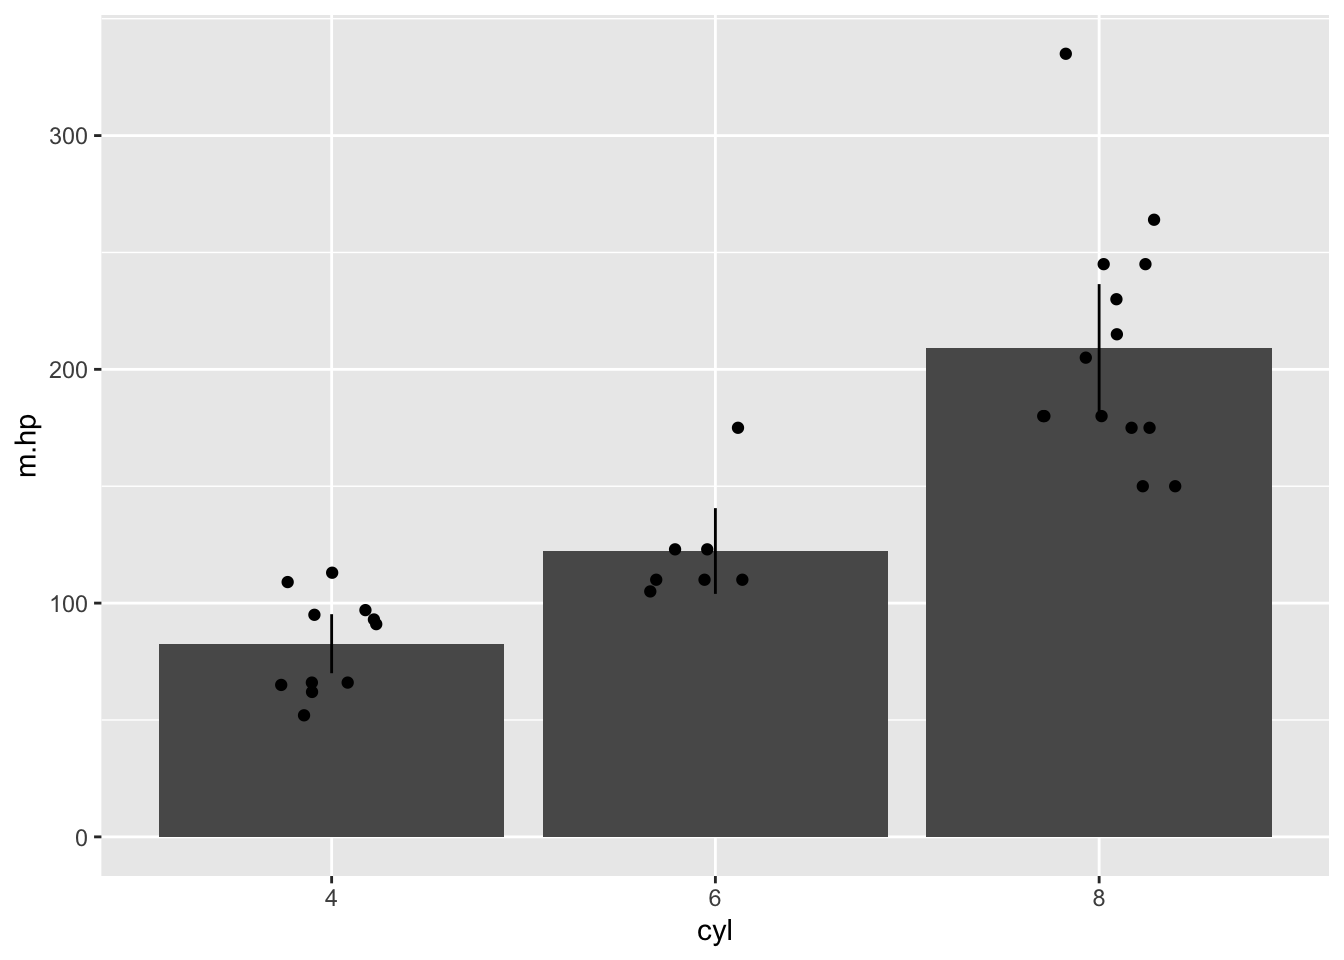
ggplot(data = s.mtcars.df, aes(x = cyl, y = m.hp)) +
  geom_point(stat="identity", size = 3)+
  geom_linerange(aes(ymin=m.hp-2*se.hp, ymax=m.hp+2*se.hp))+
  geom_point(data = mtcars.df, aes(cyl, hp), position = position_jitter(width = .2, height = 0))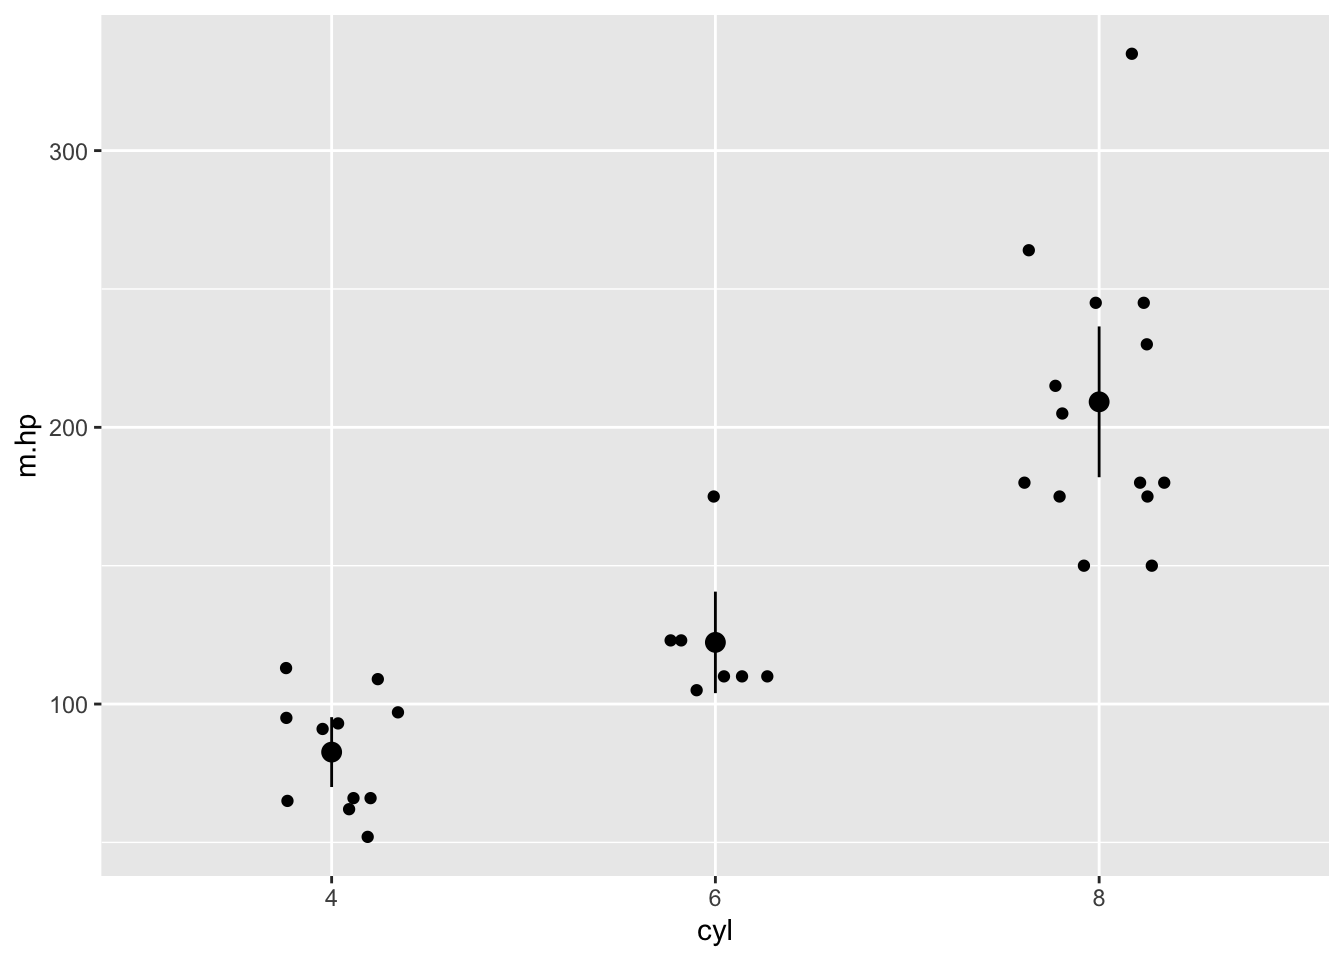
## Sina plot
ggplot(mpg, aes(as.factor(cyl), hwy))+
 geom_sina(aes(color = as.factor(cyl)),size = 1, alpha =.5) +
 geom_tufteboxplot()+
  labs(title = "ggforce: sina plot with Tufte boxplot")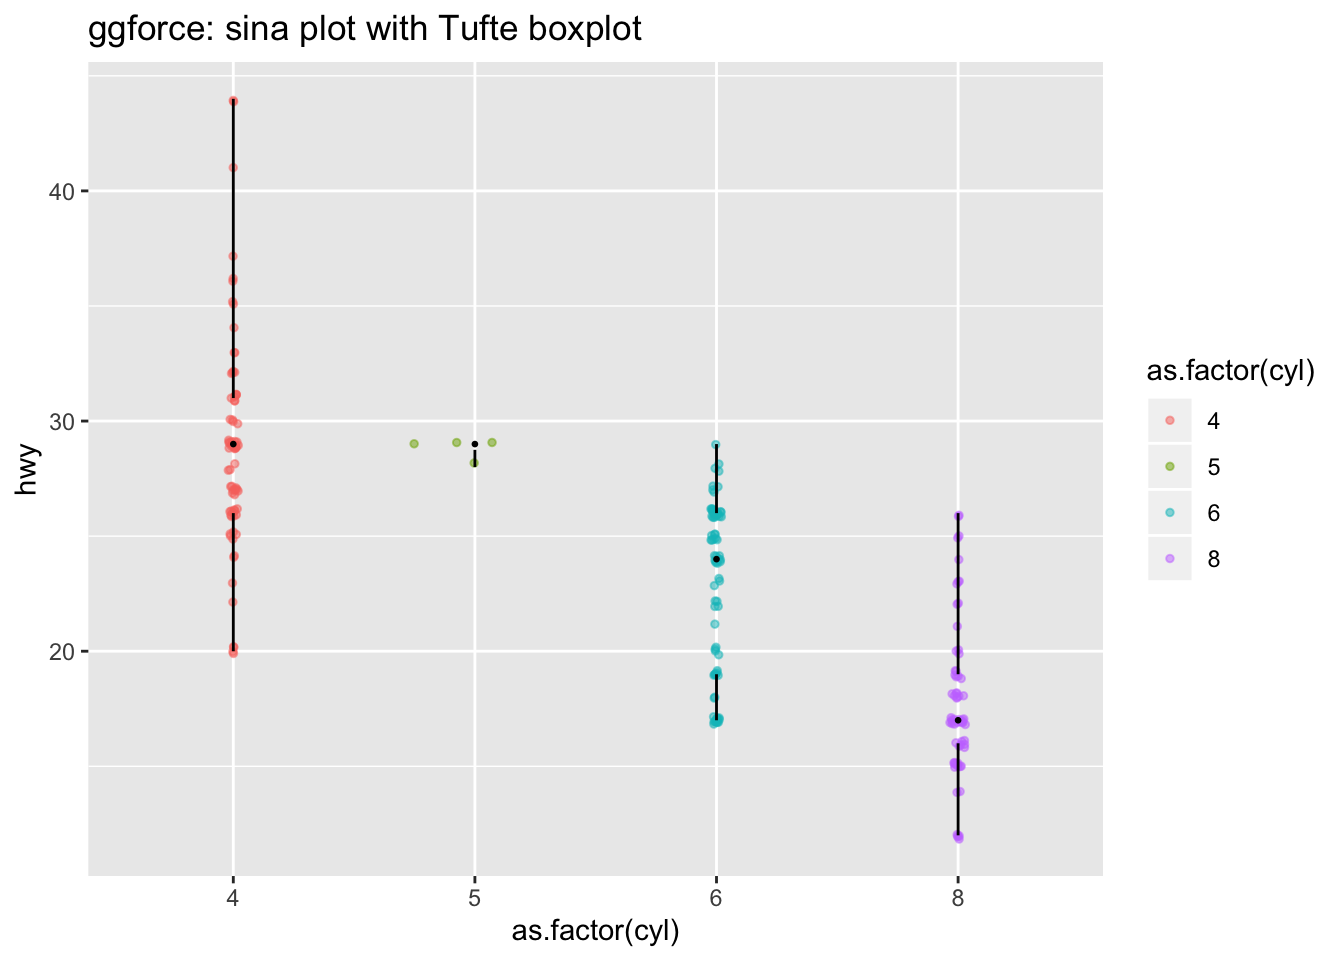
# ggplot(s.mtcars.df, aes(m.hp, m.mpg, colour =as.factor(cyl)))+
# geom_pointrangeh(aes(xmin= m.hp-se.hp, xmax = m.hp+se.hp))+
#   geom_pointrange(aes(ymin= m.mpg-se.mpg, ymax = m.mpg+se.mpg))+
#   labs(title = "ggstance: horizontal point range")

ggplot(mtcars.df, aes(as.factor(cyl), hp))+
geom_boxplot()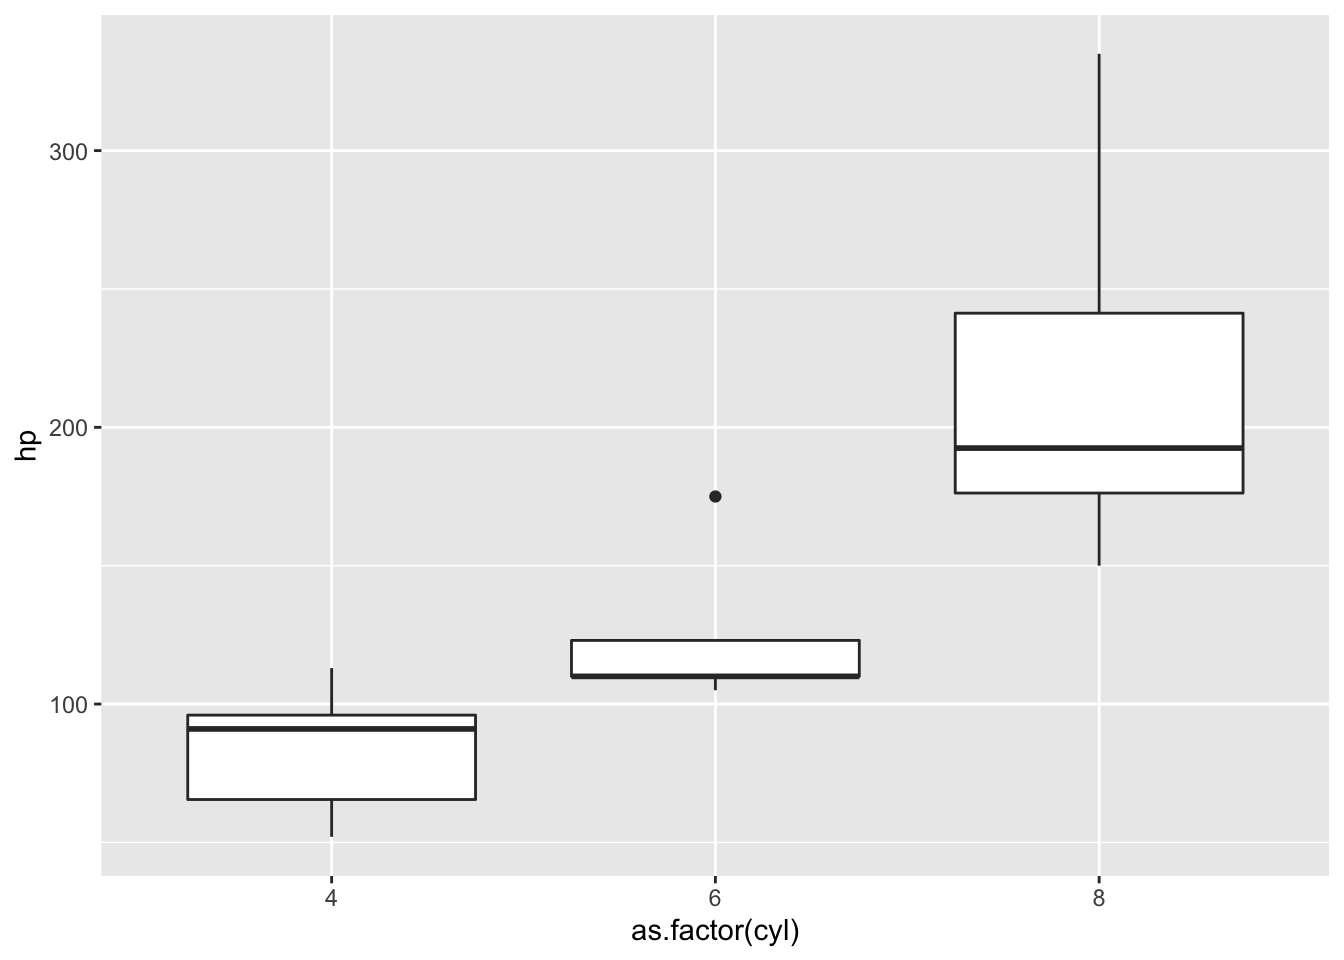
ggplot(mtcars.df, aes(as.factor(cyl), hp))+
geom_violin(draw_quantiles = c(0.25, 0.5, 0.75))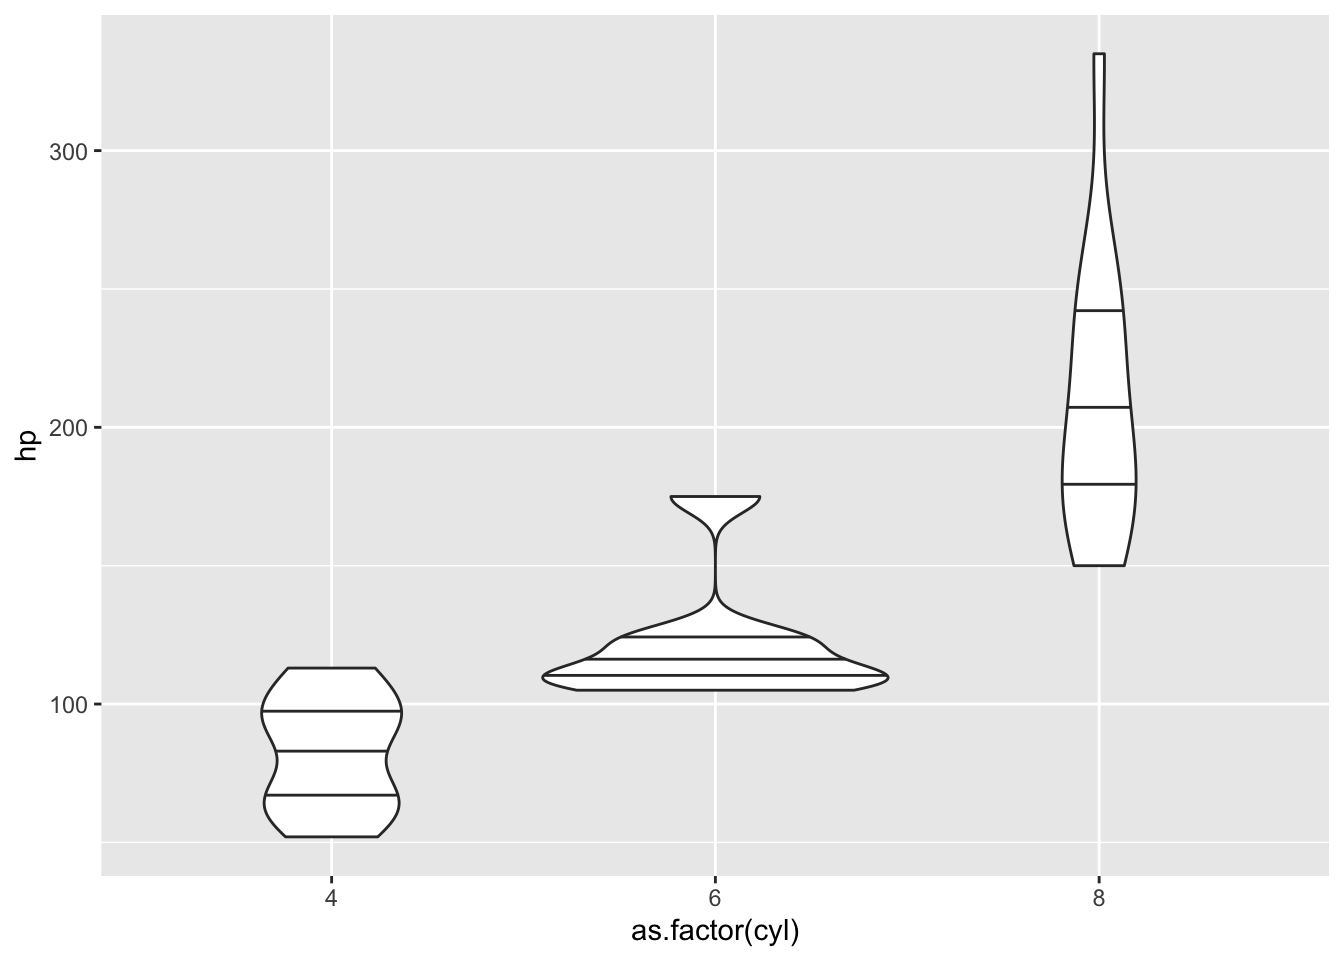
ggplot(data = s.mtcars.df, aes(x = cyl, y = m.hp)) +
  geom_violin(data= mtcars.df, aes(cyl, hp))+
  geom_point(stat="identity", size = 3)+
  geom_linerange(aes(ymin=m.hp-2*se.hp, ymax=m.hp+2*se.hp))+
  geom_point(data = mtcars.df, aes(cyl, hp),
             position = position_jitter(width = .2, height = 0), alpha =.6)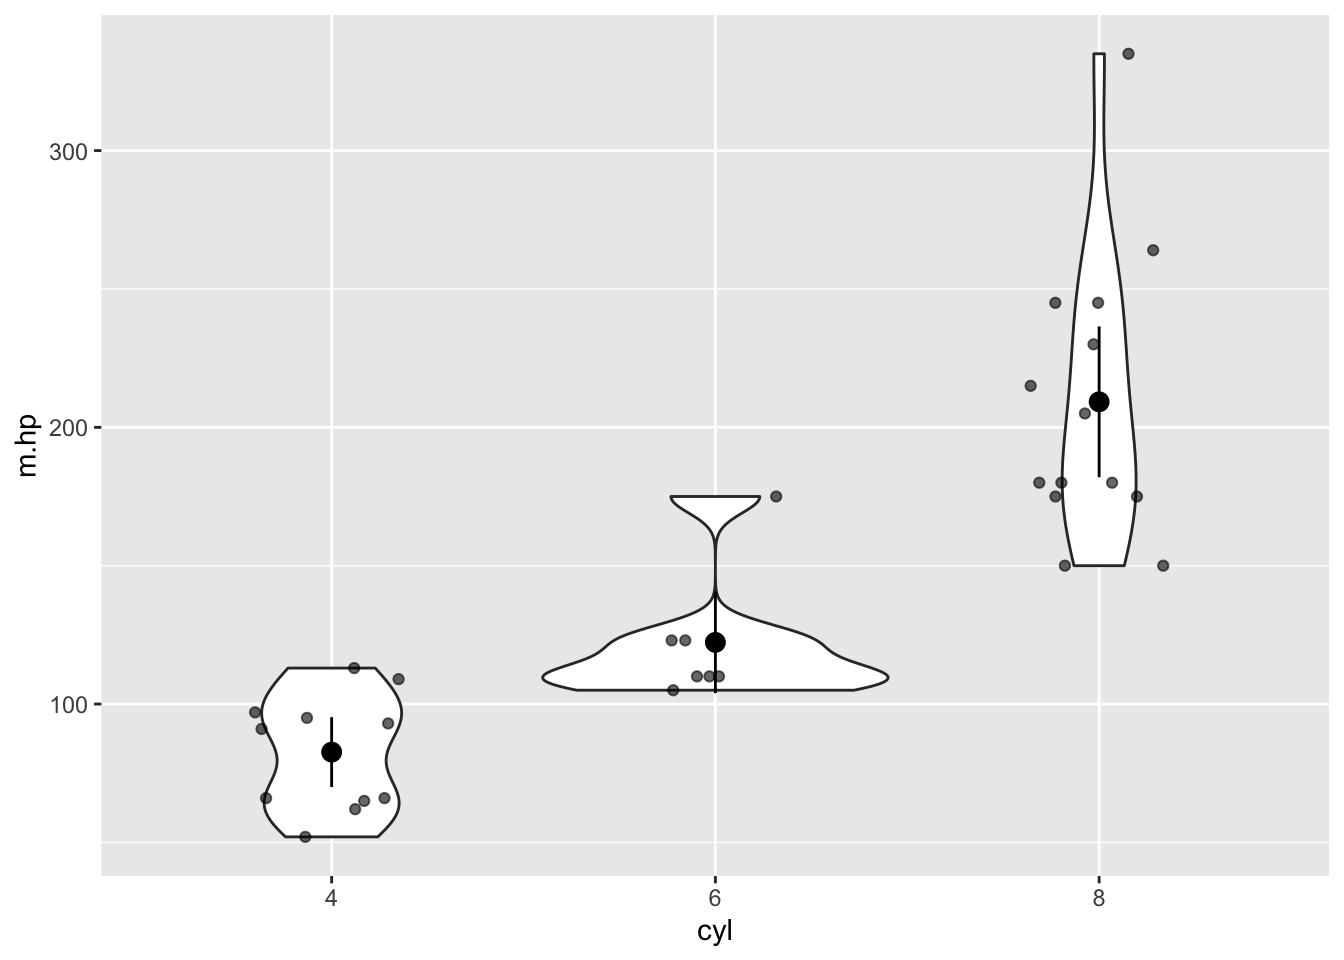
5.2.1 Compare empirical and theoretical distribution
sum.mtcars.df = mtcars.df%>% group_by(cyl) %>%
    summarise(m.hp = mean(hp), sd.hp = sd(hp))

ggplot(mtcars.df) +
  geom_boxplot(aes(as.factor(cyl), hp)) +
  geom_linerange(data = sum.mtcars.df,
        aes(x = as.factor(cyl),
        ymin = m.hp + qnorm(.25)*sd.hp, ymax = m.hp + qnorm(.75)*sd.hp),
                 size = 5, alpha = .25) +
  geom_point(data = sum.mtcars.df,
         aes(as.factor(cyl), y= m.hp),size = 6, alpha = .33)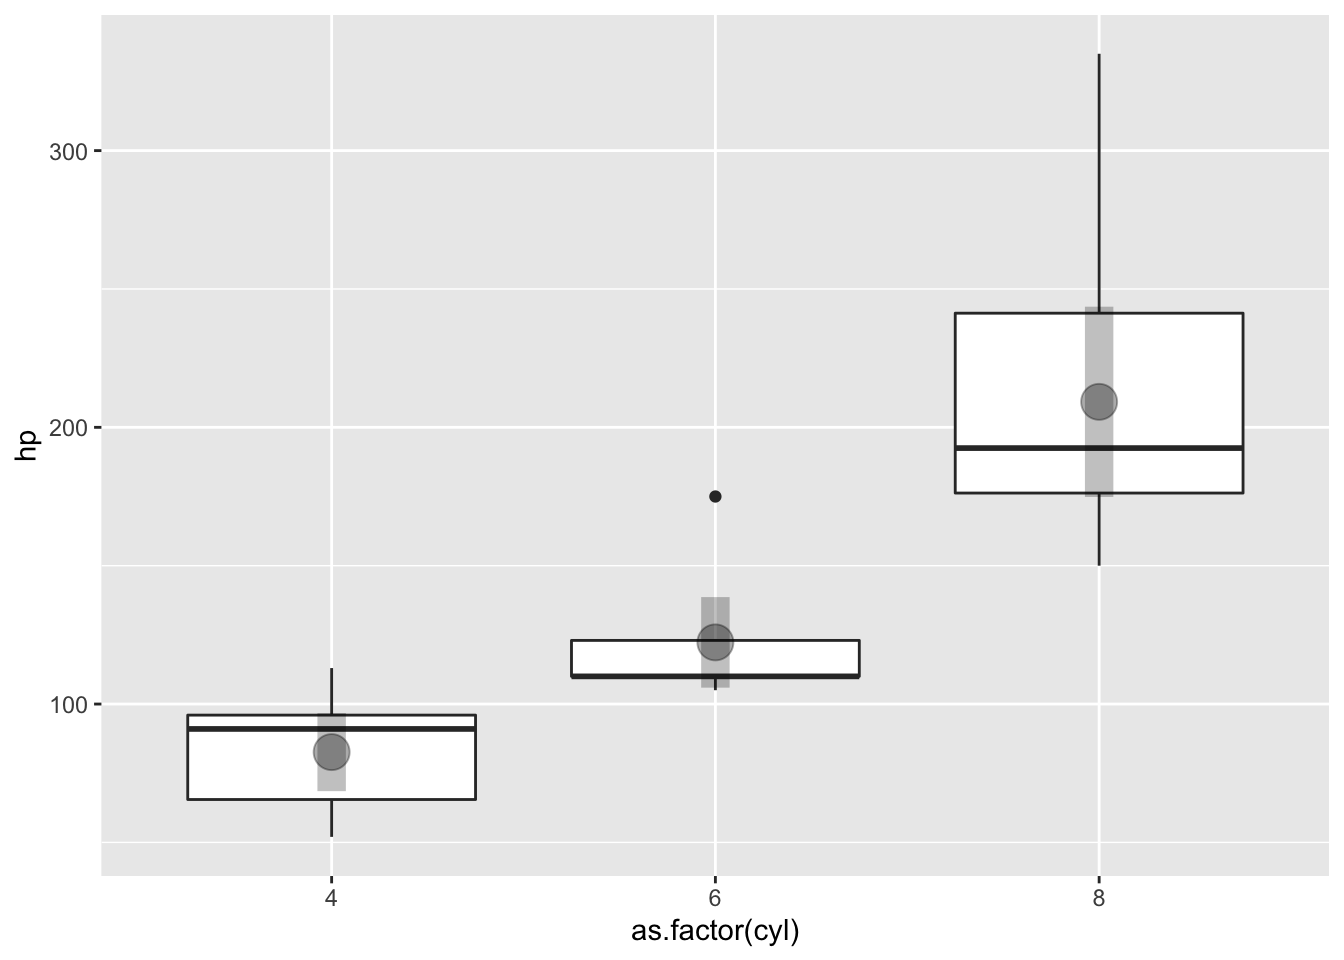
5.2.2 Tufte-inspired minimal bar chart
http://motioninsocial.com/tufte/
#TODO replace with better dataset with for more columns
library(ggthemes)
ggplot(mtcars.df, aes(x=as.factor(cyl))) +
  geom_bar(width=0.25, fill="gray") +
  scale_y_continuous(breaks=seq(2, 12, 2)) +
  geom_hline(yintercept=seq(2, 12, 2), colour="white", lwd=.5) +
  theme_tufte(base_size=12, ticks=F, base_family = "Arial")
## Warning in grid.Call(C_textBounds,
## as.graphicsAnnot(x$label), x$x, x$y, : font family
## 'Arial' not found, will use 'sans' instead
## Warning in grid.Call(C_textBounds,
## as.graphicsAnnot(x$label), x$x, x$y, : font family
## 'Arial' not found, will use 'sans' instead

## Warning in grid.Call(C_textBounds,
## as.graphicsAnnot(x$label), x$x, x$y, : font family
## 'Arial' not found, will use 'sans' instead

## Warning in grid.Call(C_textBounds,
## as.graphicsAnnot(x$label), x$x, x$y, : font family
## 'Arial' not found, will use 'sans' instead

## Warning in grid.Call(C_textBounds,
## as.graphicsAnnot(x$label), x$x, x$y, : font family
## 'Arial' not found, will use 'sans' instead

## Warning in grid.Call(C_textBounds,
## as.graphicsAnnot(x$label), x$x, x$y, : font family
## 'Arial' not found, will use 'sans' instead

## Warning in grid.Call(C_textBounds,
## as.graphicsAnnot(x$label), x$x, x$y, : font family
## 'Arial' not found, will use 'sans' instead

## Warning in grid.Call(C_textBounds,
## as.graphicsAnnot(x$label), x$x, x$y, : font family
## 'Arial' not found, will use 'sans' instead

## Warning in grid.Call(C_textBounds,
## as.graphicsAnnot(x$label), x$x, x$y, : font family
## 'Arial' not found, will use 'sans' instead

## Warning in grid.Call(C_textBounds,
## as.graphicsAnnot(x$label), x$x, x$y, : font family
## 'Arial' not found, will use 'sans' instead

## Warning in grid.Call(C_textBounds,
## as.graphicsAnnot(x$label), x$x, x$y, : font family
## 'Arial' not found, will use 'sans' instead

## Warning in grid.Call(C_textBounds,
## as.graphicsAnnot(x$label), x$x, x$y, : font family
## 'Arial' not found, will use 'sans' instead

## Warning in grid.Call(C_textBounds,
## as.graphicsAnnot(x$label), x$x, x$y, : font family
## 'Arial' not found, will use 'sans' instead

## Warning in grid.Call(C_textBounds,
## as.graphicsAnnot(x$label), x$x, x$y, : font family
## 'Arial' not found, will use 'sans' instead

## Warning in grid.Call(C_textBounds,
## as.graphicsAnnot(x$label), x$x, x$y, : font family
## 'Arial' not found, will use 'sans' instead

## Warning in grid.Call(C_textBounds,
## as.graphicsAnnot(x$label), x$x, x$y, : font family
## 'Arial' not found, will use 'sans' instead

## Warning in grid.Call(C_textBounds,
## as.graphicsAnnot(x$label), x$x, x$y, : font family
## 'Arial' not found, will use 'sans' instead

## Warning in grid.Call(C_textBounds,
## as.graphicsAnnot(x$label), x$x, x$y, : font family
## 'Arial' not found, will use 'sans' instead

## Warning in grid.Call(C_textBounds,
## as.graphicsAnnot(x$label), x$x, x$y, : font family
## 'Arial' not found, will use 'sans' instead

## Warning in grid.Call(C_textBounds,
## as.graphicsAnnot(x$label), x$x, x$y, : font family
## 'Arial' not found, will use 'sans' instead

## Warning in grid.Call(C_textBounds,
## as.graphicsAnnot(x$label), x$x, x$y, : font family
## 'Arial' not found, will use 'sans' instead

## Warning in grid.Call(C_textBounds,
## as.graphicsAnnot(x$label), x$x, x$y, : font family
## 'Arial' not found, will use 'sans' instead

## Warning in grid.Call(C_textBounds,
## as.graphicsAnnot(x$label), x$x, x$y, : font family
## 'Arial' not found, will use 'sans' instead

## Warning in grid.Call(C_textBounds,
## as.graphicsAnnot(x$label), x$x, x$y, : font family
## 'Arial' not found, will use 'sans' instead

## Warning in grid.Call(C_textBounds,
## as.graphicsAnnot(x$label), x$x, x$y, : font family
## 'Arial' not found, will use 'sans' instead

## Warning in grid.Call(C_textBounds,
## as.graphicsAnnot(x$label), x$x, x$y, : font family
## 'Arial' not found, will use 'sans' instead

## Warning in grid.Call(C_textBounds,
## as.graphicsAnnot(x$label), x$x, x$y, : font family
## 'Arial' not found, will use 'sans' instead

## Warning in grid.Call(C_textBounds,
## as.graphicsAnnot(x$label), x$x, x$y, : font family
## 'Arial' not found, will use 'sans' instead

## Warning in grid.Call(C_textBounds,
## as.graphicsAnnot(x$label), x$x, x$y, : font family
## 'Arial' not found, will use 'sans' instead

## Warning in grid.Call(C_textBounds,
## as.graphicsAnnot(x$label), x$x, x$y, : font family
## 'Arial' not found, will use 'sans' instead

## Warning in grid.Call(C_textBounds,
## as.graphicsAnnot(x$label), x$x, x$y, : font family
## 'Arial' not found, will use 'sans' instead
## Warning in grid.Call(C_textBounds,
## as.graphicsAnnot(x$label), x$x, x$y, : font family
## 'Arial' not found, will use 'sans' instead
## Warning in grid.Call(C_textBounds,
## as.graphicsAnnot(x$label), x$x, x$y, : font family
## 'Arial' not found, will use 'sans' instead
## Warning in grid.Call(C_textBounds,
## as.graphicsAnnot(x$label), x$x, x$y, : font family
## 'Arial' not found, will use 'sans' instead
## Warning in grid.Call(C_textBounds,
## as.graphicsAnnot(x$label), x$x, x$y, : font family
## 'Arial' not found, will use 'sans' instead
## Warning in grid.Call(C_textBounds,
## as.graphicsAnnot(x$label), x$x, x$y, : font family
## 'Arial' not found, will use 'sans' instead
## Warning in grid.Call(C_textBounds,
## as.graphicsAnnot(x$label), x$x, x$y, : font family
## 'Arial' not found, will use 'sans' instead
## Warning in grid.Call(C_textBounds,
## as.graphicsAnnot(x$label), x$x, x$y, : font family
## 'Arial' not found, will use 'sans' instead
## Warning in grid.Call(C_textBounds,
## as.graphicsAnnot(x$label), x$x, x$y, : font family
## 'Arial' not found, will use 'sans' instead
## Warning in grid.Call(C_textBounds,
## as.graphicsAnnot(x$label), x$x, x$y, : font family
## 'Arial' not found, will use 'sans' instead
## Warning in grid.Call(C_textBounds,
## as.graphicsAnnot(x$label), x$x, x$y, : font family
## 'Arial' not found, will use 'sans' instead
## Warning in grid.Call(C_textBounds,
## as.graphicsAnnot(x$label), x$x, x$y, : font family
## 'Arial' not found, will use 'sans' instead
## Warning in grid.Call(C_textBounds,
## as.graphicsAnnot(x$label), x$x, x$y, : font family
## 'Arial' not found, will use 'sans' instead
## Warning in grid.Call(C_textBounds,
## as.graphicsAnnot(x$label), x$x, x$y, : font family
## 'Arial' not found, will use 'sans' instead
## Warning in grid.Call(C_textBounds,
## as.graphicsAnnot(x$label), x$x, x$y, : font family
## 'Arial' not found, will use 'sans' instead
## Warning in grid.Call(C_textBounds,
## as.graphicsAnnot(x$label), x$x, x$y, : font family
## 'Arial' not found, will use 'sans' instead
## Warning in grid.Call(C_textBounds,
## as.graphicsAnnot(x$label), x$x, x$y, : font family
## 'Arial' not found, will use 'sans' instead
## Warning in grid.Call(C_textBounds,
## as.graphicsAnnot(x$label), x$x, x$y, : font family
## 'Arial' not found, will use 'sans' instead
## Warning in grid.Call(C_textBounds,
## as.graphicsAnnot(x$label), x$x, x$y, : font family
## 'Arial' not found, will use 'sans' instead
## Warning in grid.Call(C_textBounds,
## as.graphicsAnnot(x$label), x$x, x$y, : font family
## 'Arial' not found, will use 'sans' instead
## Warning in grid.Call(C_textBounds,
## as.graphicsAnnot(x$label), x$x, x$y, : font family
## 'Arial' not found, will use 'sans' instead
## Warning in grid.Call(C_textBounds,
## as.graphicsAnnot(x$label), x$x, x$y, : font family
## 'Arial' not found, will use 'sans' instead
## Warning in grid.Call(C_textBounds,
## as.graphicsAnnot(x$label), x$x, x$y, : font family
## 'Arial' not found, will use 'sans' instead
## Warning in grid.Call(C_textBounds,
## as.graphicsAnnot(x$label), x$x, x$y, : font family
## 'Arial' not found, will use 'sans' instead
## Warning in grid.Call(C_textBounds,
## as.graphicsAnnot(x$label), x$x, x$y, : font family
## 'Arial' not found, will use 'sans' instead
## Warning in grid.Call(C_textBounds,
## as.graphicsAnnot(x$label), x$x, x$y, : font family
## 'Arial' not found, will use 'sans' instead
## Warning in grid.Call(C_textBounds,
## as.graphicsAnnot(x$label), x$x, x$y, : font family
## 'Arial' not found, will use 'sans' instead
## Warning in grid.Call(C_textBounds,
## as.graphicsAnnot(x$label), x$x, x$y, : font family
## 'Arial' not found, will use 'sans' instead
## Warning in grid.Call(C_textBounds,
## as.graphicsAnnot(x$label), x$x, x$y, : font family
## 'Arial' not found, will use 'sans' instead
## Warning in grid.Call(C_textBounds,
## as.graphicsAnnot(x$label), x$x, x$y, : font family
## 'Arial' not found, will use 'sans' instead
## Warning in grid.Call(C_textBounds,
## as.graphicsAnnot(x$label), x$x, x$y, : font family
## 'Arial' not found, will use 'sans' instead
## Warning in grid.Call(C_textBounds,
## as.graphicsAnnot(x$label), x$x, x$y, : font family
## 'Arial' not found, will use 'sans' instead
## Warning in grid.Call(C_textBounds,
## as.graphicsAnnot(x$label), x$x, x$y, : font family
## 'Arial' not found, will use 'sans' instead
## Warning in grid.Call(C_textBounds,
## as.graphicsAnnot(x$label), x$x, x$y, : font family
## 'Arial' not found, will use 'sans' instead
## Warning in grid.Call(C_textBounds,
## as.graphicsAnnot(x$label), x$x, x$y, : font family
## 'Arial' not found, will use 'sans' instead
## Warning in grid.Call(C_textBounds,
## as.graphicsAnnot(x$label), x$x, x$y, : font family
## 'Arial' not found, will use 'sans' instead
## Warning in grid.Call(C_textBounds,
## as.graphicsAnnot(x$label), x$x, x$y, : font family
## 'Arial' not found, will use 'sans' instead
## Warning in grid.Call(C_textBounds,
## as.graphicsAnnot(x$label), x$x, x$y, : font family
## 'Arial' not found, will use 'sans' instead
## Warning in grid.Call(C_textBounds,
## as.graphicsAnnot(x$label), x$x, x$y, : font family
## 'Arial' not found, will use 'sans' instead
## Warning in grid.Call(C_textBounds,
## as.graphicsAnnot(x$label), x$x, x$y, : font family
## 'Arial' not found, will use 'sans' instead
## Warning in grid.Call(C_textBounds,
## as.graphicsAnnot(x$label), x$x, x$y, : font family
## 'Arial' not found, will use 'sans' instead
## Warning in grid.Call(C_textBounds,
## as.graphicsAnnot(x$label), x$x, x$y, : font family
## 'Arial' not found, will use 'sans' instead
## Warning in grid.Call(C_textBounds,
## as.graphicsAnnot(x$label), x$x, x$y, : font family
## 'Arial' not found, will use 'sans' instead
## Warning in grid.Call(C_textBounds,
## as.graphicsAnnot(x$label), x$x, x$y, : font family
## 'Arial' not found, will use 'sans' instead
## Warning in grid.Call(C_textBounds,
## as.graphicsAnnot(x$label), x$x, x$y, : font family
## 'Arial' not found, will use 'sans' instead
## Warning in grid.Call(C_textBounds,
## as.graphicsAnnot(x$label), x$x, x$y, : font family
## 'Arial' not found, will use 'sans' instead
## Warning in grid.Call(C_textBounds,
## as.graphicsAnnot(x$label), x$x, x$y, : font family
## 'Arial' not found, will use 'sans' instead
## Warning in grid.Call(C_textBounds,
## as.graphicsAnnot(x$label), x$x, x$y, : font family
## 'Arial' not found, will use 'sans' instead
## Warning in grid.Call(C_textBounds,
## as.graphicsAnnot(x$label), x$x, x$y, : font family
## 'Arial' not found, will use 'sans' instead
## Warning in grid.Call(C_textBounds,
## as.graphicsAnnot(x$label), x$x, x$y, : font family
## 'Arial' not found, will use 'sans' instead
## Warning in grid.Call(C_textBounds,
## as.graphicsAnnot(x$label), x$x, x$y, : font family
## 'Arial' not found, will use 'sans' instead
## Warning in grid.Call(C_textBounds,
## as.graphicsAnnot(x$label), x$x, x$y, : font family
## 'Arial' not found, will use 'sans' instead
## Warning in grid.Call(C_textBounds,
## as.graphicsAnnot(x$label), x$x, x$y, : font family
## 'Arial' not found, will use 'sans' instead
## Warning in grid.Call(C_textBounds,
## as.graphicsAnnot(x$label), x$x, x$y, : font family
## 'Arial' not found, will use 'sans' instead
## Warning in grid.Call(C_textBounds,
## as.graphicsAnnot(x$label), x$x, x$y, : font family
## 'Arial' not found, will use 'sans' instead
## Warning in grid.Call(C_textBounds,
## as.graphicsAnnot(x$label), x$x, x$y, : font family
## 'Arial' not found, will use 'sans' instead
## Warning in grid.Call(C_textBounds,
## as.graphicsAnnot(x$label), x$x, x$y, : font family
## 'Arial' not found, will use 'sans' instead
## Warning in grid.Call(C_textBounds,
## as.graphicsAnnot(x$label), x$x, x$y, : font family
## 'Arial' not found, will use 'sans' instead
## Warning in grid.Call(C_textBounds,
## as.graphicsAnnot(x$label), x$x, x$y, : font family
## 'Arial' not found, will use 'sans' instead
## Warning in grid.Call(C_textBounds,
## as.graphicsAnnot(x$label), x$x, x$y, : font family
## 'Arial' not found, will use 'sans' instead
## Warning in grid.Call(C_textBounds,
## as.graphicsAnnot(x$label), x$x, x$y, : font family
## 'Arial' not found, will use 'sans' instead
## Warning in grid.Call(C_textBounds,
## as.graphicsAnnot(x$label), x$x, x$y, : font family
## 'Arial' not found, will use 'sans' instead
## Warning in grid.Call(C_textBounds,
## as.graphicsAnnot(x$label), x$x, x$y, : font family
## 'Arial' not found, will use 'sans' instead
## Warning in grid.Call(C_textBounds,
## as.graphicsAnnot(x$label), x$x, x$y, : font family
## 'Arial' not found, will use 'sans' instead
## Warning in grid.Call(C_textBounds,
## as.graphicsAnnot(x$label), x$x, x$y, : font family
## 'Arial' not found, will use 'sans' instead
## Warning in grid.Call(C_textBounds,
## as.graphicsAnnot(x$label), x$x, x$y, : font family
## 'Arial' not found, will use 'sans' instead
## Warning in grid.Call(C_textBounds,
## as.graphicsAnnot(x$label), x$x, x$y, : font family
## 'Arial' not found, will use 'sans' instead
## Warning in grid.Call(C_textBounds,
## as.graphicsAnnot(x$label), x$x, x$y, : font family
## 'Arial' not found, will use 'sans' instead
## Warning in grid.Call(C_textBounds,
## as.graphicsAnnot(x$label), x$x, x$y, : font family
## 'Arial' not found, will use 'sans' instead
## Warning in grid.Call(C_textBounds,
## as.graphicsAnnot(x$label), x$x, x$y, : font family
## 'Arial' not found, will use 'sans' instead
## Warning in grid.Call(C_textBounds,
## as.graphicsAnnot(x$label), x$x, x$y, : font family
## 'Arial' not found, will use 'sans' instead
## Warning in grid.Call(C_textBounds,
## as.graphicsAnnot(x$label), x$x, x$y, : font family
## 'Arial' not found, will use 'sans' instead
## Warning in grid.Call(C_textBounds,
## as.graphicsAnnot(x$label), x$x, x$y, : font family
## 'Arial' not found, will use 'sans' instead
## Warning in grid.Call(C_textBounds,
## as.graphicsAnnot(x$label), x$x, x$y, : font family
## 'Arial' not found, will use 'sans' instead
## Warning in grid.Call(C_textBounds,
## as.graphicsAnnot(x$label), x$x, x$y, : font family
## 'Arial' not found, will use 'sans' instead
## Warning in grid.Call(C_textBounds,
## as.graphicsAnnot(x$label), x$x, x$y, : font family
## 'Arial' not found, will use 'sans' instead
## Warning in grid.Call(C_textBounds,
## as.graphicsAnnot(x$label), x$x, x$y, : font family
## 'Arial' not found, will use 'sans' instead
## Warning in grid.Call(C_textBounds,
## as.graphicsAnnot(x$label), x$x, x$y, : font family
## 'Arial' not found, will use 'sans' instead
## Warning in grid.Call(C_textBounds,
## as.graphicsAnnot(x$label), x$x, x$y, : font family
## 'Arial' not found, will use 'sans' instead
## Warning in grid.Call(C_textBounds,
## as.graphicsAnnot(x$label), x$x, x$y, : font family
## 'Arial' not found, will use 'sans' instead
## Warning in grid.Call(C_textBounds,
## as.graphicsAnnot(x$label), x$x, x$y, : font family
## 'Arial' not found, will use 'sans' instead
## Warning in grid.Call(C_textBounds,
## as.graphicsAnnot(x$label), x$x, x$y, : font family
## 'Arial' not found, will use 'sans' instead
## Warning in grid.Call(C_textBounds,
## as.graphicsAnnot(x$label), x$x, x$y, : font family
## 'Arial' not found, will use 'sans' instead
## Warning in grid.Call(C_textBounds,
## as.graphicsAnnot(x$label), x$x, x$y, : font family
## 'Arial' not found, will use 'sans' instead
## Warning in grid.Call(C_textBounds,
## as.graphicsAnnot(x$label), x$x, x$y, : font family
## 'Arial' not found, will use 'sans' instead## Warning in grid.Call.graphics(C_text,
## as.graphicsAnnot(x$label), x$x, x$y, : font family
## 'Arial' not found, will use 'sans' instead
## Warning in grid.Call.graphics(C_text,
## as.graphicsAnnot(x$label), x$x, x$y, : font family
## 'Arial' not found, will use 'sans' instead

## Warning in grid.Call.graphics(C_text,
## as.graphicsAnnot(x$label), x$x, x$y, : font family
## 'Arial' not found, will use 'sans' instead

## Warning in grid.Call.graphics(C_text,
## as.graphicsAnnot(x$label), x$x, x$y, : font family
## 'Arial' not found, will use 'sans' instead

## Warning in grid.Call.graphics(C_text,
## as.graphicsAnnot(x$label), x$x, x$y, : font family
## 'Arial' not found, will use 'sans' instead

## Warning in grid.Call.graphics(C_text,
## as.graphicsAnnot(x$label), x$x, x$y, : font family
## 'Arial' not found, will use 'sans' instead

## Warning in grid.Call.graphics(C_text,
## as.graphicsAnnot(x$label), x$x, x$y, : font family
## 'Arial' not found, will use 'sans' instead

## Warning in grid.Call.graphics(C_text,
## as.graphicsAnnot(x$label), x$x, x$y, : font family
## 'Arial' not found, will use 'sans' instead

## Warning in grid.Call.graphics(C_text,
## as.graphicsAnnot(x$label), x$x, x$y, : font family
## 'Arial' not found, will use 'sans' instead

## Warning in grid.Call.graphics(C_text,
## as.graphicsAnnot(x$label), x$x, x$y, : font family
## 'Arial' not found, will use 'sans' instead
## Warning in grid.Call.graphics(C_text,
## as.graphicsAnnot(x$label), x$x, x$y, : font family
## 'Arial' not found, will use 'sans' instead
## Warning in grid.Call.graphics(C_text,
## as.graphicsAnnot(x$label), x$x, x$y, : font family
## 'Arial' not found, will use 'sans' instead
## Warning in grid.Call.graphics(C_text,
## as.graphicsAnnot(x$label), x$x, x$y, : font family
## 'Arial' not found, will use 'sans' instead
## Warning in grid.Call.graphics(C_text,
## as.graphicsAnnot(x$label), x$x, x$y, : font family
## 'Arial' not found, will use 'sans' instead
## Warning in grid.Call.graphics(C_text,
## as.graphicsAnnot(x$label), x$x, x$y, : font family
## 'Arial' not found, will use 'sans' instead
## Warning in grid.Call.graphics(C_text,
## as.graphicsAnnot(x$label), x$x, x$y, : font family
## 'Arial' not found, will use 'sans' instead
## Warning in grid.Call.graphics(C_text,
## as.graphicsAnnot(x$label), x$x, x$y, : font family
## 'Arial' not found, will use 'sans' instead
## Warning in grid.Call.graphics(C_text,
## as.graphicsAnnot(x$label), x$x, x$y, : font family
## 'Arial' not found, will use 'sans' instead## Warning in grid.Call(C_textBounds,
## as.graphicsAnnot(x$label), x$x, x$y, : font family
## 'Arial' not found, will use 'sans' instead
## Warning in grid.Call(C_textBounds,
## as.graphicsAnnot(x$label), x$x, x$y, : font family
## 'Arial' not found, will use 'sans' instead

## Warning in grid.Call(C_textBounds,
## as.graphicsAnnot(x$label), x$x, x$y, : font family
## 'Arial' not found, will use 'sans' instead

## Warning in grid.Call(C_textBounds,
## as.graphicsAnnot(x$label), x$x, x$y, : font family
## 'Arial' not found, will use 'sans' instead
## Warning in grid.Call(C_textBounds,
## as.graphicsAnnot(x$label), x$x, x$y, : font family
## 'Arial' not found, will use 'sans' instead
## Warning in grid.Call(C_textBounds,
## as.graphicsAnnot(x$label), x$x, x$y, : font family
## 'Arial' not found, will use 'sans' instead
## Warning in grid.Call(C_textBounds,
## as.graphicsAnnot(x$label), x$x, x$y, : font family
## 'Arial' not found, will use 'sans' instead
## Warning in grid.Call(C_textBounds,
## as.graphicsAnnot(x$label), x$x, x$y, : font family
## 'Arial' not found, will use 'sans' instead
## Warning in grid.Call(C_textBounds,
## as.graphicsAnnot(x$label), x$x, x$y, : font family
## 'Arial' not found, will use 'sans' instead
## Warning in grid.Call(C_textBounds,
## as.graphicsAnnot(x$label), x$x, x$y, : font family
## 'Arial' not found, will use 'sans' instead
## Warning in grid.Call(C_textBounds,
## as.graphicsAnnot(x$label), x$x, x$y, : font family
## 'Arial' not found, will use 'sans' instead
## Warning in grid.Call(C_textBounds,
## as.graphicsAnnot(x$label), x$x, x$y, : font family
## 'Arial' not found, will use 'sans' instead
## Warning in grid.Call(C_textBounds,
## as.graphicsAnnot(x$label), x$x, x$y, : font family
## 'Arial' not found, will use 'sans' instead
## Warning in grid.Call(C_textBounds,
## as.graphicsAnnot(x$label), x$x, x$y, : font family
## 'Arial' not found, will use 'sans' instead
## Warning in grid.Call(C_textBounds,
## as.graphicsAnnot(x$label), x$x, x$y, : font family
## 'Arial' not found, will use 'sans' instead
## Warning in grid.Call(C_textBounds,
## as.graphicsAnnot(x$label), x$x, x$y, : font family
## 'Arial' not found, will use 'sans' instead
## Warning in grid.Call(C_textBounds,
## as.graphicsAnnot(x$label), x$x, x$y, : font family
## 'Arial' not found, will use 'sans' instead
## Warning in grid.Call(C_textBounds,
## as.graphicsAnnot(x$label), x$x, x$y, : font family
## 'Arial' not found, will use 'sans' instead
## Warning in grid.Call(C_textBounds,
## as.graphicsAnnot(x$label), x$x, x$y, : font family
## 'Arial' not found, will use 'sans' instead
## Warning in grid.Call(C_textBounds,
## as.graphicsAnnot(x$label), x$x, x$y, : font family
## 'Arial' not found, will use 'sans' instead
## Warning in grid.Call(C_textBounds,
## as.graphicsAnnot(x$label), x$x, x$y, : font family
## 'Arial' not found, will use 'sans' instead
## Warning in grid.Call(C_textBounds,
## as.graphicsAnnot(x$label), x$x, x$y, : font family
## 'Arial' not found, will use 'sans' instead
## Warning in grid.Call(C_textBounds,
## as.graphicsAnnot(x$label), x$x, x$y, : font family
## 'Arial' not found, will use 'sans' instead
## Warning in grid.Call(C_textBounds,
## as.graphicsAnnot(x$label), x$x, x$y, : font family
## 'Arial' not found, will use 'sans' instead
## Warning in grid.Call(C_textBounds,
## as.graphicsAnnot(x$label), x$x, x$y, : font family
## 'Arial' not found, will use 'sans' instead
## Warning in grid.Call(C_textBounds,
## as.graphicsAnnot(x$label), x$x, x$y, : font family
## 'Arial' not found, will use 'sans' instead
## Warning in grid.Call(C_textBounds,
## as.graphicsAnnot(x$label), x$x, x$y, : font family
## 'Arial' not found, will use 'sans' instead
## Warning in grid.Call(C_textBounds,
## as.graphicsAnnot(x$label), x$x, x$y, : font family
## 'Arial' not found, will use 'sans' instead
## Warning in grid.Call(C_textBounds,
## as.graphicsAnnot(x$label), x$x, x$y, : font family
## 'Arial' not found, will use 'sans' instead
## Warning in grid.Call(C_textBounds,
## as.graphicsAnnot(x$label), x$x, x$y, : font family
## 'Arial' not found, will use 'sans' instead## Warning in grid.Call.graphics(C_text,
## as.graphicsAnnot(x$label), x$x, x$y, : font family
## 'Arial' not found, will use 'sans' instead
## Warning in grid.Call.graphics(C_text,
## as.graphicsAnnot(x$label), x$x, x$y, : font family
## 'Arial' not found, will use 'sans' instead

## Warning in grid.Call.graphics(C_text,
## as.graphicsAnnot(x$label), x$x, x$y, : font family
## 'Arial' not found, will use 'sans' instead

## Warning in grid.Call.graphics(C_text,
## as.graphicsAnnot(x$label), x$x, x$y, : font family
## 'Arial' not found, will use 'sans' instead
## Warning in grid.Call.graphics(C_text,
## as.graphicsAnnot(x$label), x$x, x$y, : font family
## 'Arial' not found, will use 'sans' instead
## Warning in grid.Call.graphics(C_text,
## as.graphicsAnnot(x$label), x$x, x$y, : font family
## 'Arial' not found, will use 'sans' instead
## Warning in grid.Call.graphics(C_text,
## as.graphicsAnnot(x$label), x$x, x$y, : font family
## 'Arial' not found, will use 'sans' instead
## Warning in grid.Call.graphics(C_text,
## as.graphicsAnnot(x$label), x$x, x$y, : font family
## 'Arial' not found, will use 'sans' instead
## Warning in grid.Call.graphics(C_text,
## as.graphicsAnnot(x$label), x$x, x$y, : font family
## 'Arial' not found, will use 'sans' instead## Warning in grid.Call(C_textBounds,
## as.graphicsAnnot(x$label), x$x, x$y, : font family
## 'Arial' not found, will use 'sans' instead
## Warning in grid.Call(C_textBounds,
## as.graphicsAnnot(x$label), x$x, x$y, : font family
## 'Arial' not found, will use 'sans' instead

## Warning in grid.Call(C_textBounds,
## as.graphicsAnnot(x$label), x$x, x$y, : font family
## 'Arial' not found, will use 'sans' instead
## Warning in grid.Call.graphics(C_text,
## as.graphicsAnnot(x$label), x$x, x$y, : font family
## 'Arial' not found, will use 'sans' instead
## Warning in grid.Call.graphics(C_text,
## as.graphicsAnnot(x$label), x$x, x$y, : font family
## 'Arial' not found, will use 'sans' instead
## Warning in grid.Call.graphics(C_text,
## as.graphicsAnnot(x$label), x$x, x$y, : font family
## 'Arial' not found, will use 'sans' instead## Warning in grid.Call(C_textBounds,
## as.graphicsAnnot(x$label), x$x, x$y, : font family
## 'Arial' not found, will use 'sans' instead
## Warning in grid.Call(C_textBounds,
## as.graphicsAnnot(x$label), x$x, x$y, : font family
## 'Arial' not found, will use 'sans' instead## Warning in grid.Call.graphics(C_text,
## as.graphicsAnnot(x$label), x$x, x$y, : font family
## 'Arial' not found, will use 'sans' instead
## Warning in grid.Call.graphics(C_text,
## as.graphicsAnnot(x$label), x$x, x$y, : font family
## 'Arial' not found, will use 'sans' instead
## Warning in grid.Call.graphics(C_text,
## as.graphicsAnnot(x$label), x$x, x$y, : font family
## 'Arial' not found, will use 'sans' instead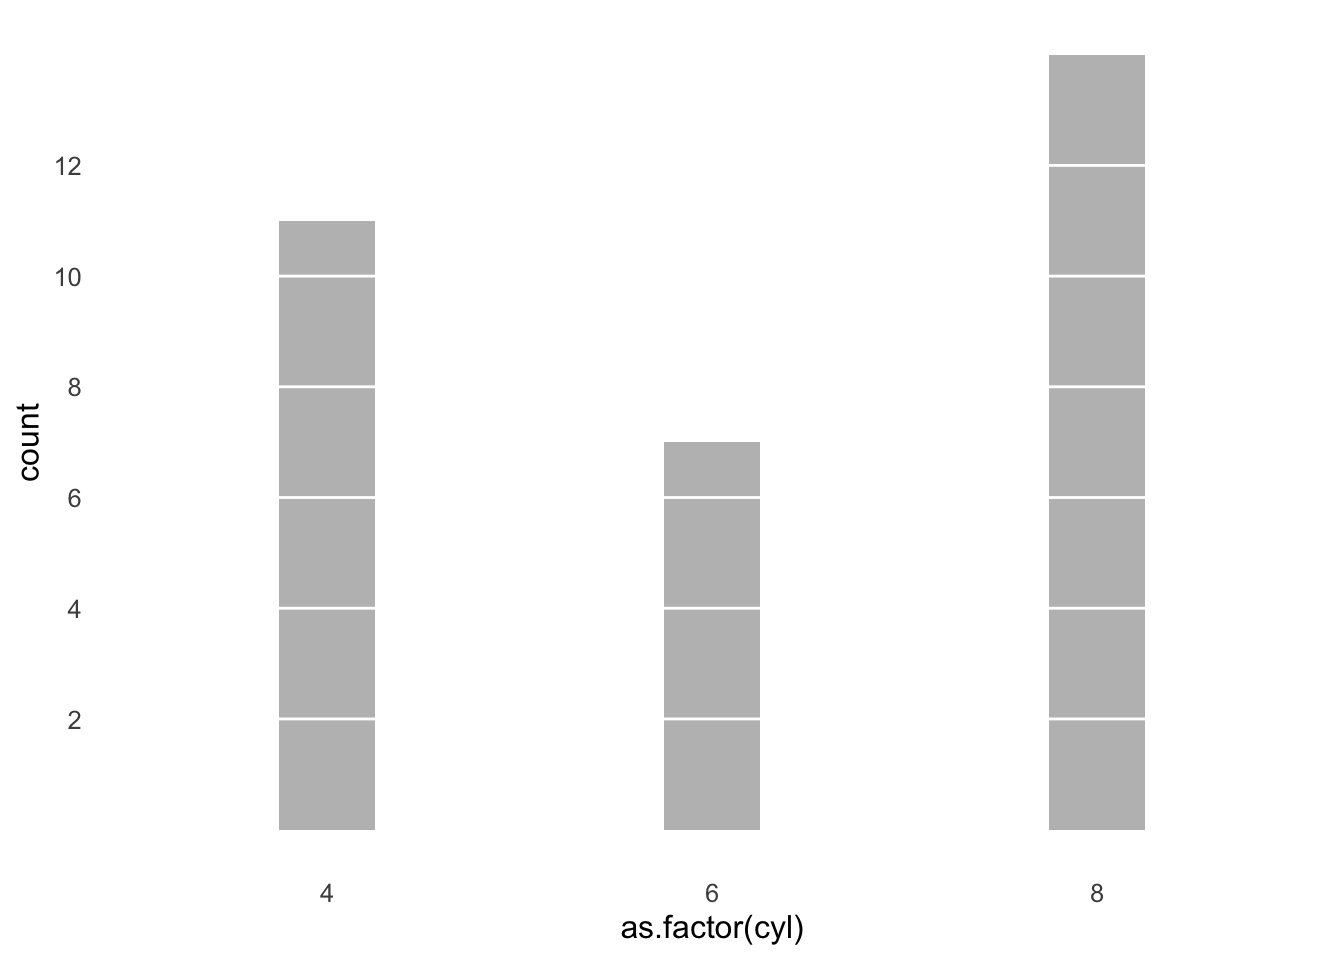
5.3 Comparing across many variables
5.3.1 Dot plots and reordering
Comparing many mean values
#TODO Change to mean sd catepilar plot
mtcars.df = mtcars
mtcars.df$name = rownames(mtcars.df)
ggplot(data = mtcars.df, aes(reorder(name, hp), y = hp, colour = as.factor(cyl))) +
  geom_point(size = 2) +
  geom_hline(aes(yintercept = mean(hp)), colour = "darkgrey") +
  geom_linerange(aes(ymin= -Inf, ymax= hp), alpha =.5) +
  coord_flip() +
  labs(x = "Cylinders", y = "Power (hp)") +
  scale_colour_brewer(name = "Number of \nCylinders", palette="Dark2") + # http://colorbrewer2.org
  theme(legend.position = c(.75, .25)) +
  theme_minimal()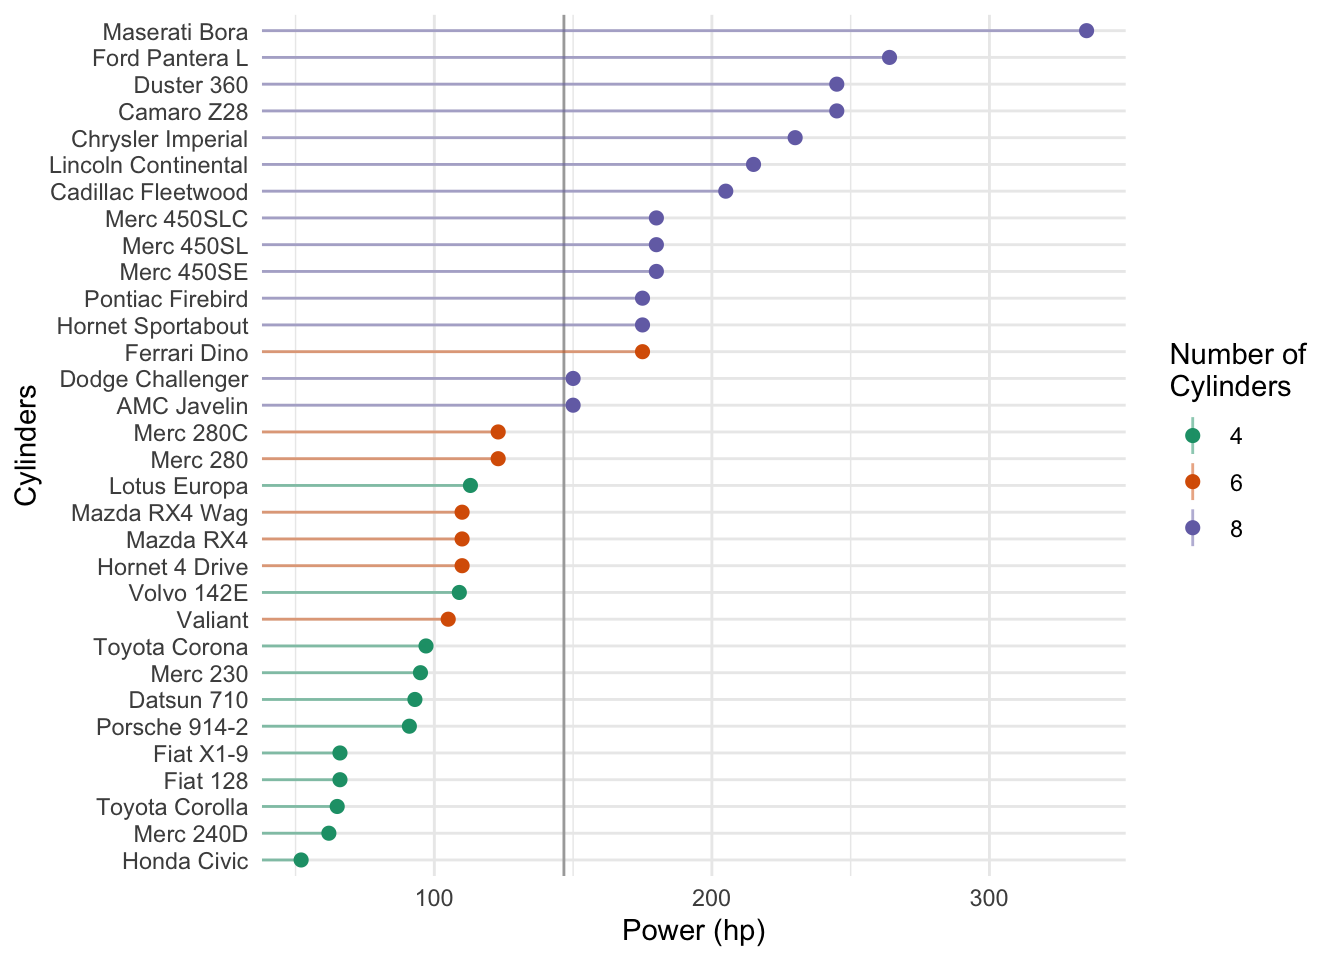
5.3.2 Point range on x and y
## Point range on x and y
#library(ggstance)
s.mtcars.df = mtcars %>% group_by(cyl) %>%
  summarise(m.hp = mean(hp), se.hp = sd(hp)/n()^.5,
            m.mpg = mean(mpg), se.mpg = sd(mpg)/n()^.5)
5.3.3 Tufte boxplot for many variables
library(ggthemes)

ggplot(mtcars, aes(factor(cyl), mpg)) +
  geom_tufteboxplot(median.type = "line", whisker.type = 'line', hoffset = 0, width = 4) +
  geom_rangeframe()
## Warning: position_dodge requires non-overlapping x
## intervals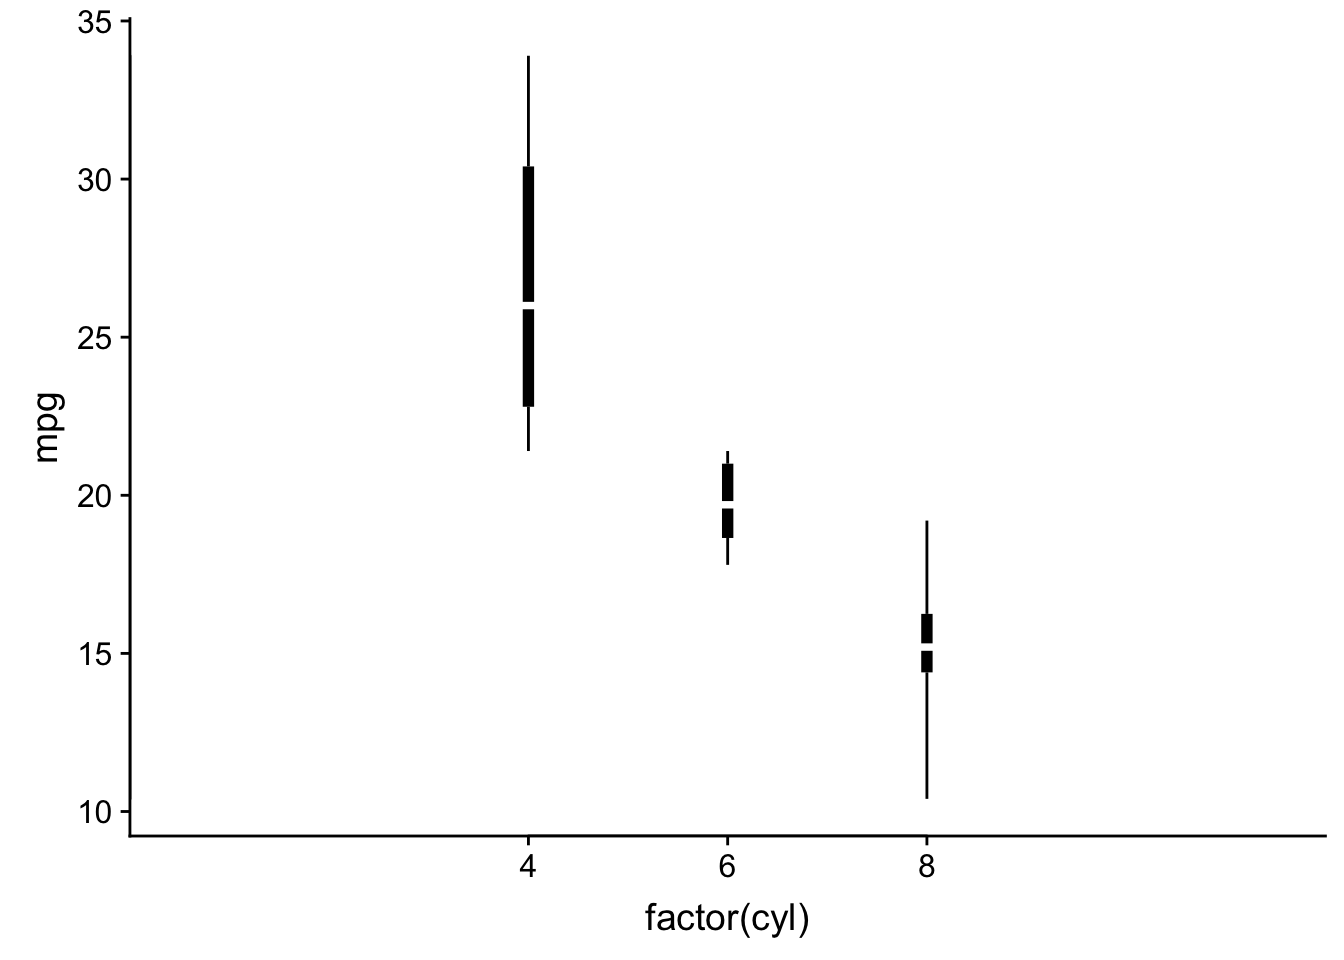
## Tufte boxplot
ggplot(mtcars, aes(as.factor(cyl), mpg))+
  geom_tufteboxplot()+
  labs(title = "ggthemes: Tufte boxplot")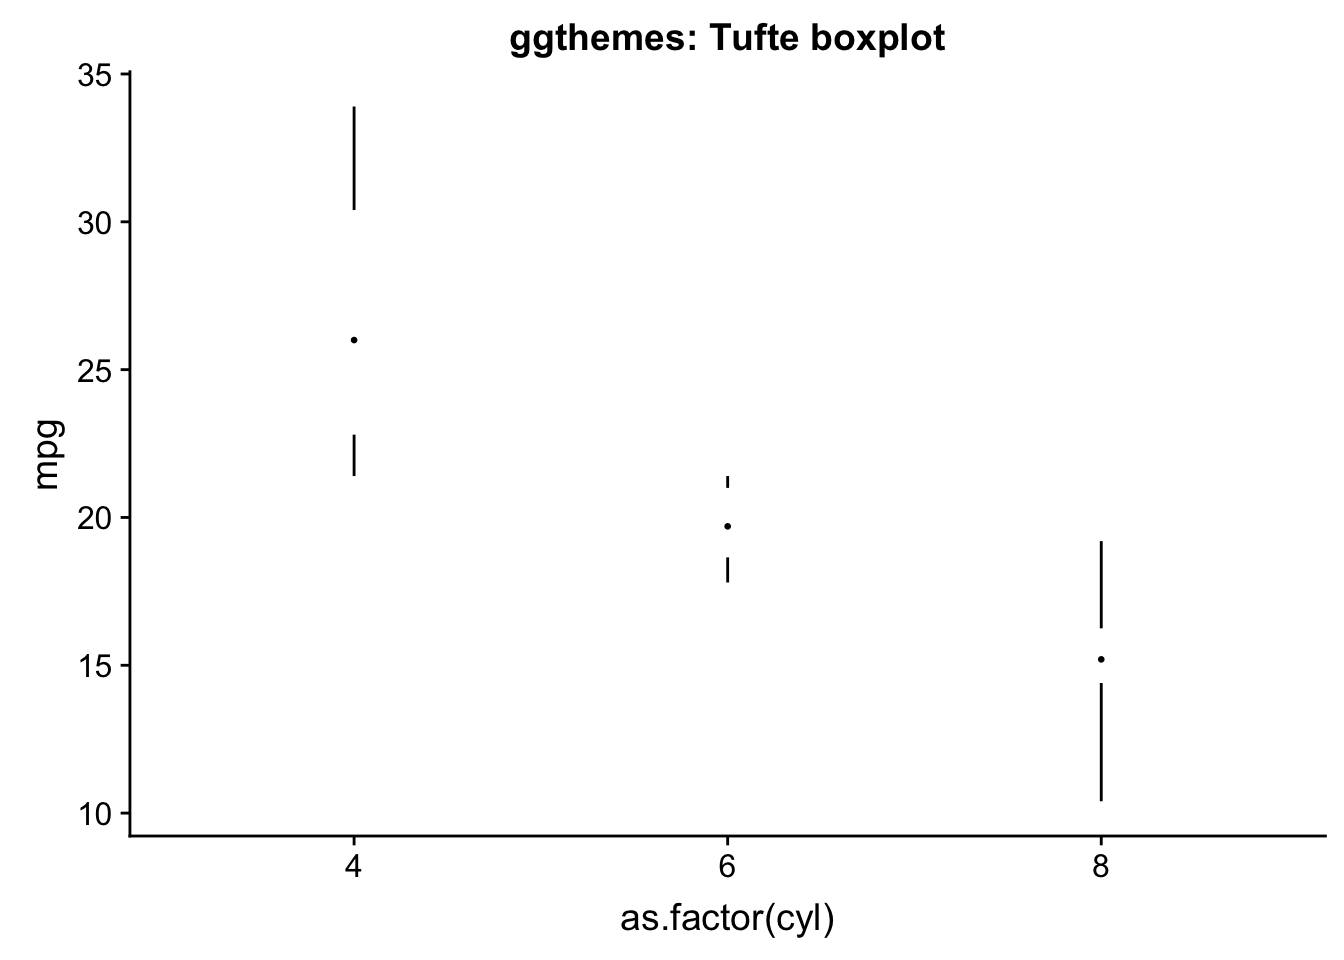
ggplot(mtcars, aes(disp, mpg, color = as.factor(cyl)))+
geom_point()+
  geom_rangeframe(size = 2, colour = "grey35")+
  labs(title = "ggthemes: Tufte range frame")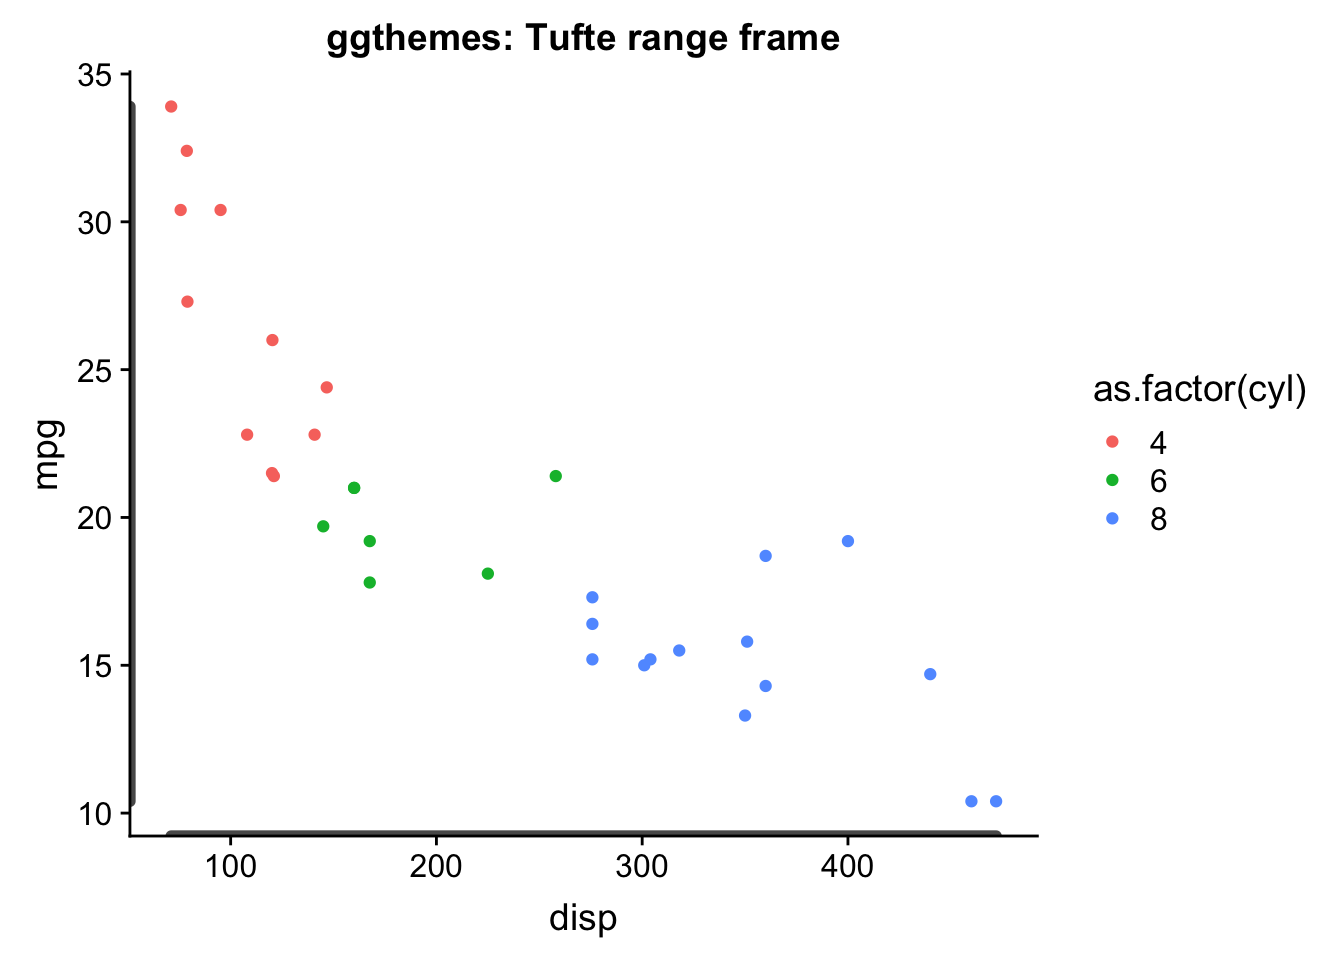
5.3.4 Tufte-inspired slope graphs
library(tidyverse)
library(ggrepel)

# https://github.com/leeper/slopegraph
cancer.df = read_csv("data/tufte-cancer-survival-data.csv")
## Parsed with column specification:
## cols(
## Type = col_character(),
## `Year 5` = col_double(),
## `Year 10` = col_double(),
## `Year 15` = col_double(),
## `Year 20` = col_double()
## )l.cancer.df = cancer.df %>% gather(key = year, value = rate, 2:5)
l.cancer.df$year = factor(l.cancer.df$year,
levels = c("Year 5", "Year 10", "Year 15", "Year 20"))
ggplot(l.cancer.df, aes(year, rate, group = Type))+
geom_line(colour = "grey70") +
geom_text_repel(data = l.cancer.df %>% filter(year == "Year 5"),
aes(label = Type), nudge_x = -.35, direction = "y",
point.padding = .02)+
geom_text_repel(data = l.cancer.df %>% filter(year=="Year 20"),
aes(label = Type), nudge_x = .35, direction = "y",
point.padding = .02)+
geom_label(aes(label = rate), colour = "grey55", label.size = .02)+
theme_void()+
theme(axis.text = element_text(size = rel(.85)),
axis.text.y=element_blank())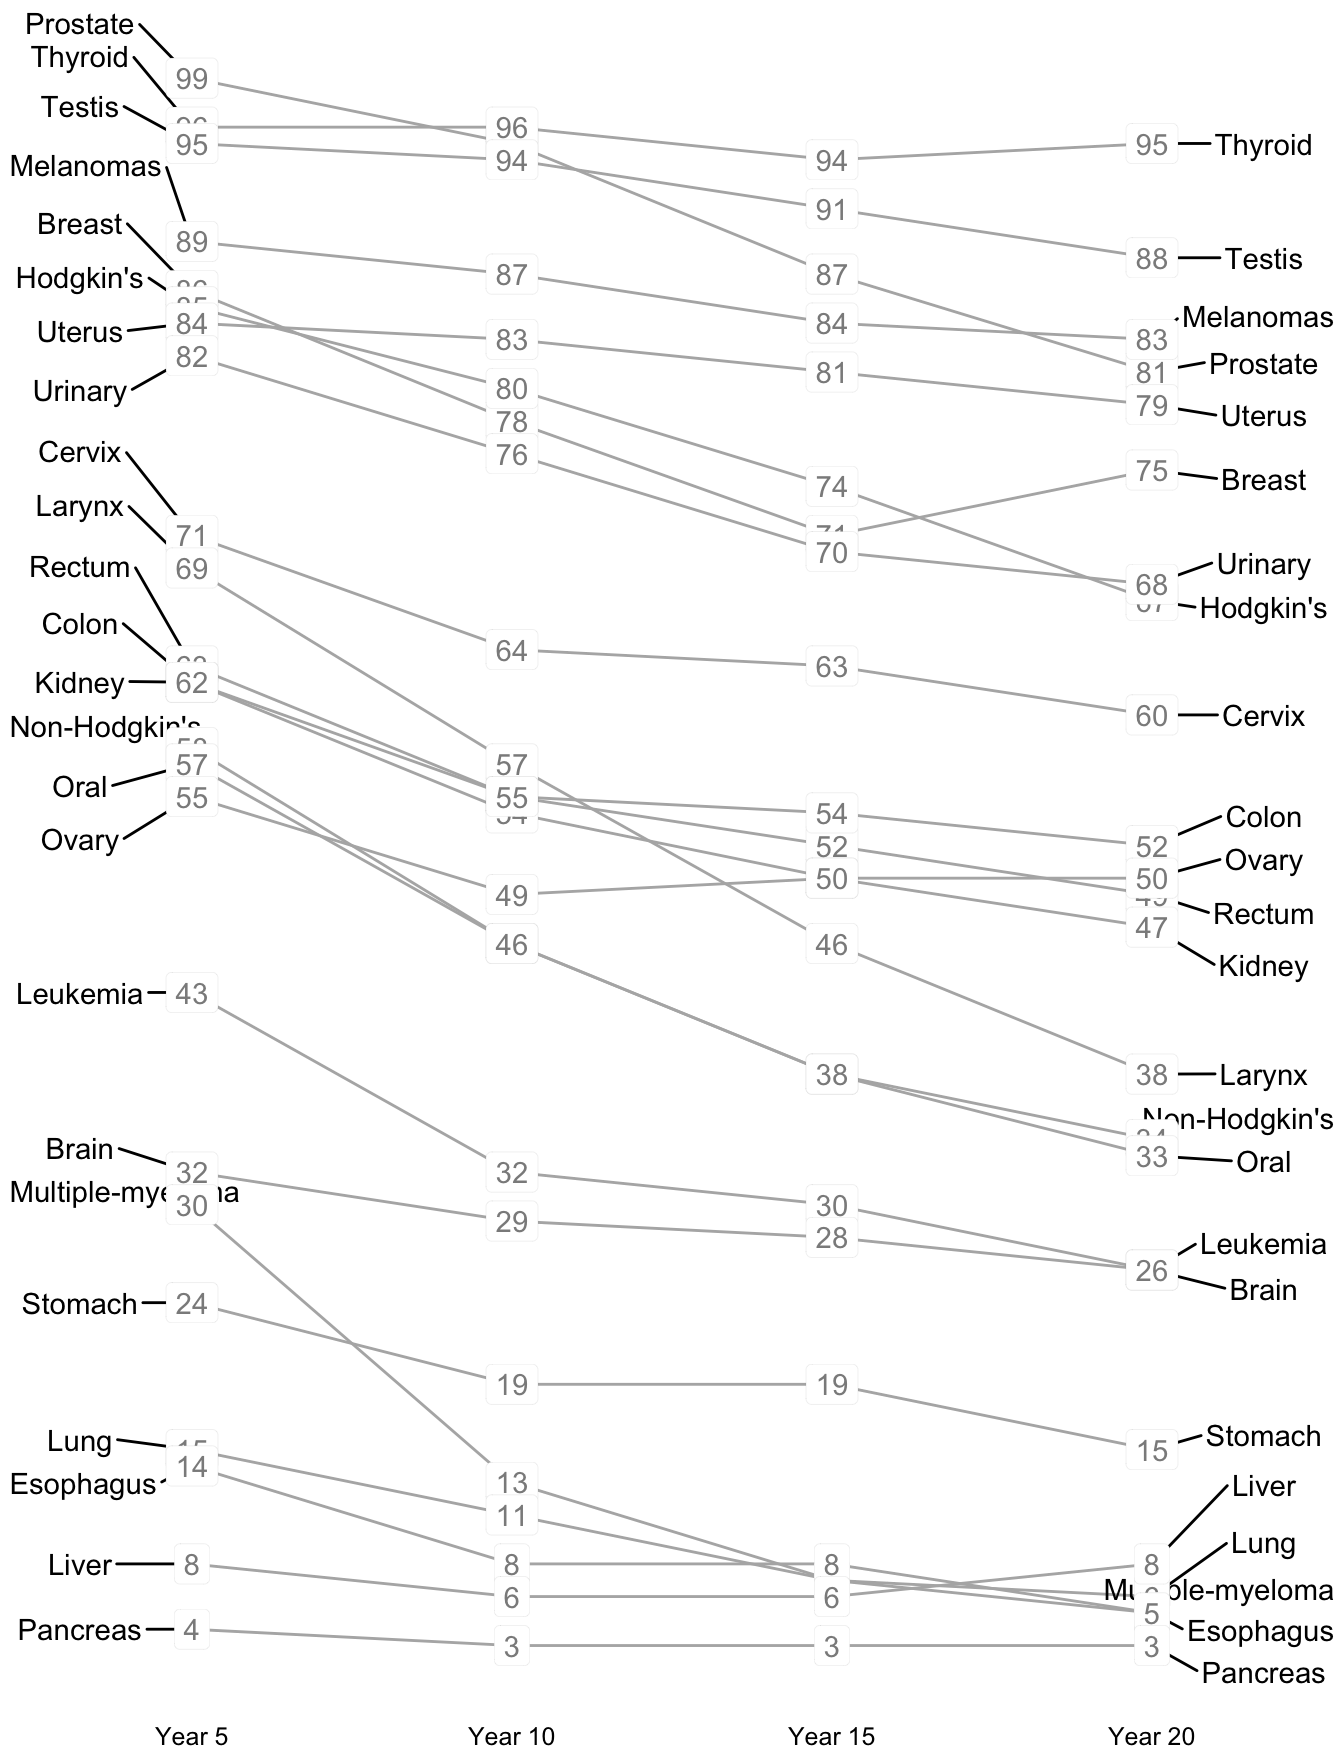
5.3.5 Parallel coordinate plot with similar items highlighted
Scatterplots can show how items relate when there are only two dimensions, but many situations involve comparison between items based on 4-10 dimensions. Parallel coordinate plots can show how items relate on many dimenions by arraying the dimesions on the horizontal axis and the value for that dimension on the vertical axis. Each line represents an item and sets of lines that rise and fall in parallel indicate similar items. For comparisons that involve more dimensions it dimensionality reduction techniques, such as PCA or t-SNE can provide a meaningful two-dimensional representation that can be easily visualized with a scatter plot.
Creating a parallel coordinate plot involves five steps: 1. Transform the variables to make uniform comparisons, such as greater values have similar meaning 2. Select variables or dimensions of interest and convert to long format–one column for the variable names and one for the values 3. Scale the items for each variable–subtract the mean value and divide by the standard deviation 4. Highlight one or more items 6. Order the variables in a meaningful fashion, such as by the standard deviation
## Highlight closest pair of items multidimensional space ##
library(tidyverse)
mtcars.df = mtcars
mtcars.df$name = row.names(mtcars.df)

## Transform variables
mtcars.df = mtcars.df %>% mutate(gpm = 1/mpg) %>% mutate(speed = 1/qsec)

## Select variables
mtcars.df = mtcars.df %>% dplyr::select(cyl:carb, gpm, speed, name)

## Convert to long format
l.mtcars.df = mtcars.df %>% gather(key = var, value = value, -name)

##  Scale values
l.scaled.mtcars.df = l.mtcars.df %>% group_by(var, s.value = scale(value)) %>%
  ungroup()

## Identify similar items
target = "Datsun 710" # specifies the row number of interest
l.scaled.mtcars.df$target_s.value = l.scaled.mtcars.df$s.value[l.scaled.mtcars.df$name==target]

l.scaled.mtcars.df = l.scaled.mtcars.df %>% group_by(name) %>%
  mutate(distance = (sum((s.value-target_s.value)^2))^0.5)


##  Scale items
scaled_mtcars.df = mtcars.df %>% mutate_at(vars(cyl:speed), scale)

## Highlight similar items
dist.df = as.matrix(dist(scaled_mtcars.df, upper = TRUE, diag = FALSE))  %>% as.data.frame()

## Find the closest vehicle to target vehicle
target = 18 # specifies the row number of interest
closest = which(min(dist.df[dist.df[, target]>0, target])==dist.df[, target])
mtcars.df$name[target]
## [1] "Fiat 128"mtcars.df$name[closest]## [1] "Toyota Corolla"## Convert to long format
l.scaled_mtcars.df = scaled_mtcars.df %>% gather(key = var, value = value, -name)
## Select pair to highlight
pair.df = l.scaled_mtcars.df %>% filter(name==mtcars.df$name[target]|name==mtcars.df$name[closest])
## Order variables by the standard deviation
library(ggrepel)
ggplot(l.scaled_mtcars.df, aes(reorder(var, value, sd), value, group = name)) +
geom_line(alpha = .3, size = .2) +
geom_line(data = pair.df, colour = "red", size = .6, alpha = .6) +
geom_label_repel(data = pair.df %>% filter(var=="speed"),
aes("speed", value, label = name), nudge_y = -.75)+
theme_minimal()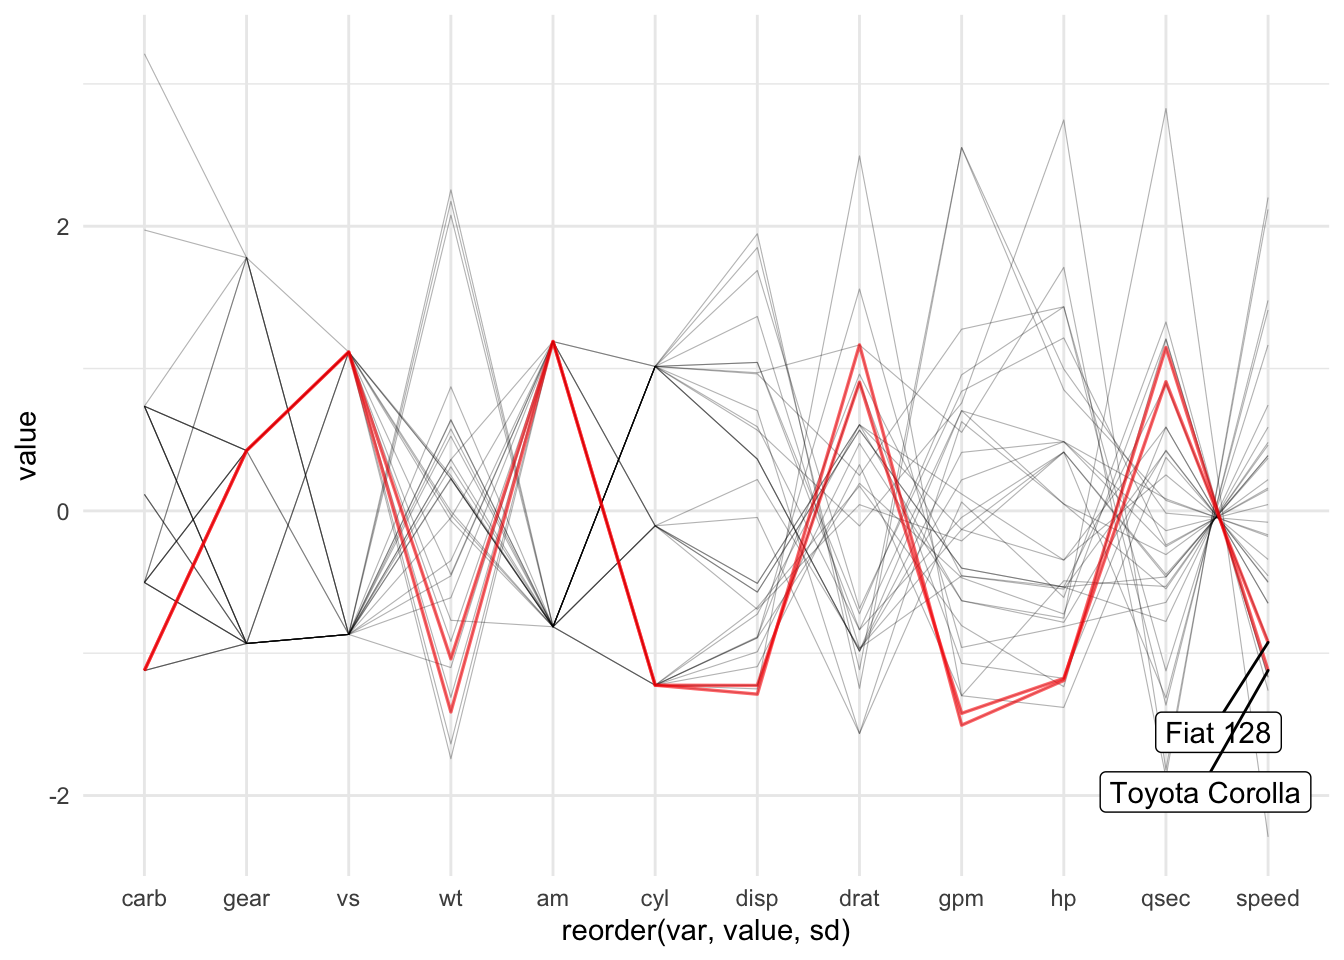
5.4 Gliphs: Chernof face and radar plots
Show patterns and outliers not precise comparisons